|
|
|
|
|
|
| Livestock Research for Rural Development 21 (5) 2009 | Guide for preparation of papers | LRRD News | Citation of this paper |
This study had two aims. Firstly, to determine the associations of month of recording (MOR) and days in milk (DIM) with somatic cell count (SCC), milk urea concentration (MU) and milk production traits (i.e. test-day milk yield, TDM; milk protein percentage, PP and milk protein yield, PY). Secondly, to evaluate the associations among SCC, MU and milk production traits by analyzing individual monthly test-day records for dairy cows raised in the Czech part of the Czech Republic. A total number of 33,881 individual test-day milk records involving 15,565 dairy cows for a 12-month period between January and December 2001 enrolled in Database Computer Center belonging to Czech Moravian Breeders´ Corporation, Inc., Hiradistko, the Czech Republic was used.
The MOR and DIM had highly significant (P<0.001) effects on the studied traits. The SCC reached the maximum level in September (504,000) associated to the lowest TDM (19.9 kg) and the lowest SCC in December (320,000) and February (335,000 cell/ml). Least squares means of TDM, categorized by 30-d increments of DIM, paralleled reversible changes in PP and followed a curvilinear shape. SCC reached to the peak in the 2nd and 3rd months of lactation then decreased gradually to the end of lactation. MU was lower (30.5 mg/dl) during the first 30 DIM compared with all other DIM categories. The statistical analysis of TDM, PY and SCC by MU showed that as MU increased, TDM, PY increased and SCC decreased. MU, SCC, PP and PY were significantly different among TDM categorized. Each of PP and SCC measures inversely associated with TDM, meanwhile MU paralleled change with TDM. Somatic cell count measures showed a paralleled change with PP.
The effects of environmental variables and associations among traits must be taken into consideration when cows are evaluated.
Keywords: dairy cattle, days in milk, environmental effects, milk urea nitrogen
Changing genetic evaluation methods from a 305-day lactation model to a test-day model has many ramifications that need to be considered (Schaeffer et al 2000). Somatic cell count and MU make provision for the determination of important aids for nutrition and health management in the herd. The SCC can serve as an indicator of possible udder problems specially mastitis while the MU can be an indicator of the nutritional status of the herd. The interpretation of these traits and parameters assists the breeders in effectively selecting cows and in making important management decisions with regard to the health status and nutrition of their herds.
Somatic cell count in milk is a long-established parameter of milk quality (Coffey et al 1986 and Weller et al 1992). The SCC is important to dairy producers both because counts that are too high can lead to poor quality or even unsaleable milk and SCC can be used to monitor mastitis incidence in the herd (Haile-Mariam et al 2001 and Mostert et al 2004). In addition, SCC is frequently used to determine quality payments to dairy producers (Wattiaux et al 2005). Another reason to reduce the SCC is to decrease the bulk milk SCC, which above a certain value results in a discount in milk price for the farmer (Calus et al 2006). Somatic cells are always present in milk and they increase due to mammary gland infections (Atakan 2008). Management and breeding decisions aim to reduce the SCC as a way to decrease the incidence of mastitis (Emanuelson et al 1988; Weller et al 1992 and Philipsson et al 1995).
The cost of mastitis to the dairy industry is associated with lost yield, discarded milk, cost of veterinarian and treatment, herdsman’s time, extended calving intervals and extra services per conception and culling (Wicks and Leaver 2006). In Canada, Dürr et al (2008) working on Ayrshire and Holstein cows concluded that sub-clinical mastitis assessed by SCC definitely jeopardizes daily milk yield in dairy cows. They concluded also that daily milk losses caused by changes in LnSCC depend on breed, parity and stage of lactation, and ignoring these factors leads to significant errors in estimating losses associated to subclinical mastitis. Moreover, lower SCC levels have been shown to be related to higher milk yield and better dairy product quality and therefore have important economic value (Kiiman and Kaart 2004).
The European Union requires that milk used for dairy products sold in its territory have SCC levels below 400,000 cells/ml and New Zealand and Australia require similar levels. Canada requires milk to have below 500,000 cells/ml (Sargeant et al 1998 and Norman et al 2000). In the United States, the current national penalty level is 750,000 cells/ml and over. Many US (organic) dairy cooperatives also require SCC to be less than 400,000 cells/ml (Van Schaik et al 2002). De Haas et al (2008) obtained a wide range of genetic correlations between udder health traits and several SCC traits. Rekik et al (2008) reported that DIM, calving age, and calving to conception interval were all together important sources of variation for SCC mainly in the first and second parities.
Additionally, MU is a relatively new test developed to assess dietary needs of lactating dairy cows (Spicer et al 2000). In USA, Jonker et al (2002) noticed that 40% of the dairy farmers in Maryland and Virginia States did not know what milk urea nitrogen (MUN) was, and 89.5% did not routinely run the MUN test. In Canada, 73% of Ontario farmers use Ontario Dairy Herd Improvement services and only 18% of these farmers test for MUN (Calberry 2003). Concentrations of MUN in milk are variable from herd-to-herd and between cows in the same herd (Arunvipas et al 2003). High values of MUN indicate an imbalance of protein and energy (Wood et al 2003). The concentration of urea is known to vary with the amount of protein in the diet, amount of urine excreted, water intake, dry matter intake, sampling methods, breed, season, herd management, energy intake and parity (Godden et al 2001b and Ferguson 2002). Godden et al (2001b) mentioned that information has been lacking for interpreting MU data, given the various sampling, cow (breed, parity, DIM), seasonal, herd management, and nutritional management factors that can all influence MU. The benefits of using MU as a monitoring tool to help optimize the efficiency of dietary protein utilization include improved efficiency and reduced cost of production, reduced nitrogen excretion into the environment and improved fertility (Baker et al 1995; Kohn et al 2005; Stoop et al 2007). MUN concentrations can be used as a practical tool to monitor dietary crude protein and energy intake relative to requirements. This type of monitoring can play an important role in dairy herd management, because 1) excess protein (N) intake may impair reproductive performance; 2) consumption of excess CP increases energy requirements; 3) protein supplements are costly feed ingredients; and 4) excess N excretion has a negative environmental impact (Broderick and Clayton, 1997).
Besides the variation in MUN related to the protein to energy ratio of the diet consumed (Oltner and Wiktorsson 1983; Oltner et al 1985; Broderick and Clayton 1997; Garcia et al 1997 and Wood et al 2003), there are managerial and productive factors associated with MU like milk yield and fat and protein contents (Carlsson et al 1995; Godden et al 2001; Rajala-Schultz and Saville 2003 and Hojman et al 2004), SCC (Hojman et al 2004), parity (Butler et al 1995; Carlsson et al 1995 and Broderick and Clayton 1997), DIM (Carlsson et al 1995 and Hojman et al 2004), month of the year (Hojman et al 2004), breed (Johnson and Young 2003) and live body weight (Kohn et al 2002 and Hojman et al 2005). Milk urea nitrogen might be used as a selection tool, and therefore, information on factors affecting it is needed (Stoop et al 2007).
On the other side, protein content of milk also has received much attention from producers of milk and processors of dairy products. Increased recognition of the value of protein in milk has led processors to pay a premium for milk exceeding minimum protein percentages. To take advantage of such pricing schemes, producers have considered protein performance for culling decisions and breeding plans (Wiggans 1986). In most countries, protein yield takes an important place in the national selection index (Miglior et al 2006) and has been associated with an increase in MUN. Field studies have been lacking that investigate the relationship between MU and efficiency of milk production.
The objectives of the present study were:
To investigate the effect of month of recording (MOR) and days in milk (DIM) on somatic cell count (SCC), milk urea concentration (MU), and milk production traits (i.e. test-day milk yield, milk protein percentage and milk protein yield).
To evaluate the associations among MU, SCC and milk production traits by analyzing individual monthly cow test-day records for dairy cattle raised in the Czech part of the Czech Republic.
A total of 33,881 individual monthly cow test-day records involving 15,565 dairy cows including cow’ number, date of test, calving date, test-day milk yield (TDM, kg), somatic cell count (SCC, 1000 cells/ml), milk urea concentration (MU, mg/dl) and percentage of milk protein (PP, %) from January to December 2001 was used in the statistical analyses. The days in milk (DIM) was defined as the interval between date of calving and milk test date. The data were enrolled in Database Computer Center belonging to Czech Moravian Breeders´ Corporation, Inc., (Czech member of International committee for Animal Recording, ICAR), Hiradistko, Czech Republic. Apparently, the majority of the cows belong to either Holstein or Czech Spotted breed and very small number of cows was Jersey. The cows were in different parities, but no distinction was made for breed or parity in the data set used in the study. Methods used for milk recording were A4 and AT (ICAR norms). From 3788 herds, 98.2 and 1.8% herds were recorded using A4 and AT methods, respectively. Generally, the total mixed ration feeding was the most common management practices on the farms located at the Czech part of CZ. The managerial and nutritional practices were nearly similar across farms. To convert MU (milk urea content) to MUN (Milk urea nitrogen), the following conversion formula can be used (after Kureoja and Kaart 2004): Milk urea content (MU, mg/dl) × 0.467 = Milk urea nitrogen (MUN, mg/dl) or the formula (after Godden et al 2001b): Milk urea content (MU, mmol/L) × 2.8 = Milk urea nitrogen (MUN, mg/dl).
Individual test-day milk samples were analyzed in the Milk Testing Laboratory of Buštehrad. Somatic cell count was estimated using Bentley Instruments (Somacount 3000, the instrument utilize a laser based flow cytometry). Protein percentage was estimated also using Bentley Instruments (Bentley 2000, infrared transmission photometer). The direct specific enzymatic method UREAKVANT (made by Agrosluzby Morava a Slezko) was used for the routine determination of the MU
Categories and computing limitations: To study the effect of fixed effects on dependent variables, the independent variables were classified into categories. Categories were selected so that the middle category encompassed the observed mean of the trait, so the upper- and lower most categories contained enough observations to be statistically and biologically meaningful. The preliminary statistical analyses showed that inclusion of calendar month in the statistical models yielded a better fit than did season of the year. Therefore, MORs were classified into 12 classes according to calendar month from January to December. Days in milk (stage of lactation) were grouped into 11 30-day classes with those greater than 300 d grouped into one category (category 11). Because SCC is frequently elevated shortly after calving, use of SCC during this period is often not recommended (Dohoo 1993). In addition, Ruegg et al (2008) pointed out that the evaluation of SCC in fresh cows should not be performed until at least 5 days post-calving, so that DIM less than five days and more than 400 days were excluded. Milk urea content was grouped by increments of 10 mg/dl with those less than 15 mg/dl grouped into one category and greater than 55 mg/dl as other category. Milk urea content less than 10 and more than 60 mg/dl was excluded. Test-day milk yield was grouped by increments of 5 kg with those less than or equal 15 kg grouped into one category, and greater than 30 kg as other category. Test-day milk yields less than 3 and more than 60 kg was excluded. Milk protein percentage was categorized into increments of 0.2% beginning with less than 3% and ending with more than 3.8%. Milk protein percentage less than 2 and more than 5% was excluded. The summation of all previously mentioned limitations for original test-day records caused the elimination of approximately one third of the records (from 31,881 to 22,153 test-day records).
Shook (1982) proposed expressing SCC on a log (base 2) scale (somatic cell score, SCS), which would result in a more normalized distribution. A further advantage of expressing SCC as SCS is that regression of milk yield on SCS is essentially linear in contrast to the relationship of yield with SCC. Since healthy cows do maintain low SCC in milk (Capuco and Akers, 1999), so that cows with a SCS of 0-3 are generally considered uninfected while cows with a SCS of 7-9 are considered clinically infected with mastitis. The breeder should strive to maximize the percentage of cows in the 0-3 category and minimize the percentage in the 7-9 category. For this purpose, SCS levels (0-9 classes) were categorized into five categories as follows: 0-3, 4, 5, 6 and 7-9 for categories 1, 2, 3, 4 and 5, respectively.
Dependent variables were TDM, PP, PY, MU and SCC. Moreover, to evaluate SCC, two methods of evaluating were used: the first was the actual somatic cell count (SCC, 1000 cell/ml). Somatic cell count less than 1000 and more than 7,000,000 cell/ml milk was excluded. The second method was linear somatic cell count score (SCS) defined by Raubertas and Shook (1982). To approximate the normal distribution, a natural logarithmic transformation of the SCC was used. A score of 0 to 9 was assigned to each sample day according to SCC level. Each integer increase (or decrease) in linear score is associated with a doubling (or halving) of the actual SCC as shown in Table 1. The scores have a number of advantages over SCC (Raubertas and Shook 1982) as mentioned above.
|
Table 1. Relationship between SCC scores (SCS) and somatic cell count (Raubertas and Shook 1982) |
||||
|
SCS |
SCC range (x1000) |
Mid-point SCC (x 1000) |
Milk Production Loss (lbs/305-day) |
|
|
Lactation 1 |
Lactation 2 |
|||
|
0 |
0 – 18 |
12,5 |
--- |
--- |
|
1 |
19 – 35 |
25 |
--- |
--- |
|
2 |
36 – 71 |
50 |
--- |
--- |
|
3 |
72 – 141 |
100 |
-204 |
-408 |
|
4 |
142 – 283 |
200 |
-408 |
-816 |
|
5 |
284 – 565 |
400 |
-612 |
-1224 |
|
6 |
566 - 1130 |
800 |
-816 |
-1632 |
|
7 |
1131 – 2262 |
1600 |
-1020 |
-2040 |
|
8 |
2263 – 4523 |
3200 |
-1224 |
-2448 |
|
9 |
4524 - 9999 |
6400 |
-1432 |
-2864 |
Information on cow's number, cow’s TDM (kg), PP (%), SCC (1000 cell/ml), DIM (day), MU (mg/dl) on each test day record were available. Missing values in any record caused a record to be excluded if the analysis included that variable. Data were analyzed using General Linear Model procedure (GLM). Data analysis was performed using the Statistical Analysis System (SAS/STAT 9.1 User's Guide, 2004). To control the repeated measures on different test-day record at the same cow level, repeated measures statements were used in the statistical analyses. In order to allow the inclusion of repeated measures statements in the statistical model, a minimum of two dependent variables per statistical model was imposed for the statistical analysis by SAS (2004) as shown in Table 2.
|
Table 2. A list of dependent variables (traits) and independent variables (fixed effects) and their definitions used in the statistical model for bivariate analysis of variance* |
||||||
|
Dependent variable (trait) |
Independent variable (Fixed effect) |
|||||
|
MOR |
DIM |
SSC |
MUC |
MYC |
PPC |
|
|
SCC and SCS |
X |
X |
|
X |
X |
X |
|
MU and PY |
X |
X |
X |
|
X |
X |
|
TDM and PY |
X |
X |
X |
X |
|
X |
|
PP and PY |
X |
X |
X |
X |
X |
|
|
* MOR=month of recording, DIM=days in milk (day), MUC=milk urea content categories (mg/dl), PPC=protein percentage categories (%), MYC= test-day milk yield categories (kg), SSC=somatic cell score categories, SCC= Somatic cell count (x1000) , SCS= Somatic cell score, TDM= Test-day milk yield (kg), MU= Milk urea content (mg/dl), PP=Protein percentage (%), PY= Protein yield (kg) |
||||||
Protein yield trait was added to each of MU, TDM and PP statistical model to overcome the repeated measure statement that needs to multivariate- not univariate analysis to enable an analysis of MU, TDM, and PP for different levels of each variable. Because of these computational limitations, only two traits were analyzed simultaneously using the same statistical model and therefore, the traits were grouped in four statistical models as follows: 1) SCC and SCS, 2) MU and PY, 3) TDM and PY and 4) PP and PY. Whereas there are three models for PY, the last one (PP and PY) was used in the present results (Table 2).
An F-test was conducted to obtain an indication about the importance (level of significance, p) of the fixed effects. Multiple comparisons were made with P-values adjusted using Tukey’s procedure. Test of significance between LSM of the levels in each fixed effect was made using the option: PDIFF adjust=Tukey in the LSMEAN statement (Tukey-Kramer test, SAS, 2004).
A general linear model (Proc GLM, SAS, Version 9.1) was used to analyze records of TDM, PP, PY, SCC, SCS and MU and included the fixed effects of month of recording and DIM for all variables as well as the other categories according to the variable. The dependent and independent variables used in the statistical model for each two traits (bivariate analysis) are given in Table 2.
The following general linear fixed model was used to study the factors affecting the total variation in somatic cell count measures (SCC and SCS):
Yijklmn = μ + MORi + DIMj + MUCk + MYCl + PPCm + eijklmn (1)
where:
yijklmn = somatic cell measure (SCC or SCS) of a definite cow,
μ = mean somatic cell measure (SCC or SCS),
MORi = month of recording i fixed effect (i = 1-12),
DIMj = days in milk j fixed effect (j = 1-11),
MUCk = milk urea content categories k fixed effect (k = 1-6),
MYCl = test-day milk yield categories l fixed effect (l = 1-5),
PPCm = protein percentage categories k fixed effect (m = 1-6), and
eijklmn = random error.
To study the importance of the recorded factors affecting total variation in milk urea content (MU), the following bivariate analysis of variance model was used:
Yijklmn = μ + MORi + DIMj + SSCk + MYCl + PPCm + eijklmn (2)
where:
yijklmn = test-day milk yield (TDM) or protein yield (PY) of a definite cow,
μ = mean MU or PY,
SSCk = somatic cell score categories m fixed effect (k = 1-5), and
The other definitions as mentioned in Equation 1.
The following bivariate analysis of variance model was used to study the importance of the recorded factors affecting total variation in test-day milk yield (TDM):
Yijklmn = μ + MORi + DIMj + SSCk + MUCl + PPCm + eijklmn (3)
where:
yijklmn = test-day milk yield (TDM) or protein yield (PY) of a definite cow,
μ = mean TDM or PY, and
The other definitions as mentioned in Equations 1 and 2.
The following general linear fixed model was used to study the factors affecting the total variation in both protein percentage (PP) and protein yield (PY):
Yijklmn = μ + MORi + DIMj + SSCk + MUCl + MYCm + eijklmn (4)
where:
yijklmn = protein percentage or protein yield of a definite cow,
μ = mean PP or PY,
The other definitions as mentioned in Equations 1 and 2.
Using PROC MEANS of SAS (SAS Inst., Inc., Cary, NC), test-day records were averaged for each individual cow. In addition, distribution of classes under each variable included in the test-day records was described using PROC FREQ. In a previous paper by the author (Oudah 2008), using the same data set, the phenotypic relationships including correlations and regressions coefficients, prediction equations and overall means for all traits were discussed. Descriptive statistics (i.e. mean, SD, CV %, minimum, and maximum) were also computed for TDM, PP, PY, SCC, SCS, MU and DIM using SAS (SAS, 2004). Summary of the descriptive statistics of test-day records is shown in Table 3.
|
Table 3. Unadjusted means, standard deviation (SD), coefficient of variation (CV%), minimum and maximum of test-day records* |
||||||
|
Trait |
No. |
Mean |
SD |
CV% |
Min. |
Max. |
|
test-day milk yield, kg |
31848 |
22.6 |
8.50 |
37.6 |
3 |
59.8 |
|
Protein percentage, % |
31517 |
3.38 |
0.36 |
10.7 |
2.03 |
4.98 |
|
Protein yield, kg |
31502 |
0.75 |
0.26 |
34.7 |
0.07 |
1.91 |
|
Somatic cell count, 1000 cell/ml |
22857 |
404 |
750 |
185.6 |
1 |
6992 |
|
Somatic cell score |
22857 |
3.76 |
1.85 |
50.4 |
0 |
9 |
|
Milk urea content, mg/dl |
30788 |
31.7 |
9.99 |
31.5 |
10 |
60 |
|
Days in milk, day |
31750 |
156 |
90.0 |
58.1 |
5 |
400 |
|
* All abbreviations and definitions as mentioned in Table 2 |
||||||
All of the variables included in the statistical models significantly (P < 0.05, 0.01 or 0.001) influenced SCC, SCS, MU, TDM, PP and PY (R2 = 0.04 to 0.84) (Table 4).
|
Table 4.
Mean-square values of analysis of variance and level of significance
of test-day traits as affected by non-genetic |
|||||||
|
Source of variation |
d.f |
Mean squares (Type III SS) |
|||||
|
SCC |
SCS |
MU |
TDM |
PP |
PY |
||
|
Fixed effects |
|||||||
|
MOR |
11 |
6445440*** |
39.3*** |
16446*** |
2338*** |
12.7*** |
0.65*** |
|
DIM |
10 |
5935563*** |
8.00** |
2585*** |
12256*** |
31.1*** |
0.63*** |
|
SSC |
4 |
|
|
2999*** |
2490*** |
6.76*** |
0.03* |
|
MUC |
5 |
10858217*** |
77.7*** |
|
24322*** |
1.59*** |
0.18*** |
|
MYC |
4 |
32650278*** |
330*** |
62782*** |
|
25.2*** |
221*** |
|
PPC |
5 |
25263001*** |
213*** |
2959*** |
13058*** |
|
|
|
Residual |
|
568605 |
3.238 |
106.697 |
44.872 |
0.0918 |
0.0109 |
|
Descriptive statistics for models used in the GLM procedure |
|||||||
|
No. of observations |
22,877 |
22,877 |
22,146 |
22,146 |
22,146 |
22,146 |
|
|
Significance |
P<0.0001 |
P<0.0001 |
P<0.0001 |
P<0.0001 |
P<0.0001 |
P<0.0001 |
|
|
R-square |
0.04 |
0.07 |
0.18 |
0.36 |
32.0 |
84.0 |
|
|
Mean |
410.3 |
3.75 |
32.3 |
22.1 |
3.40 |
0.739 |
|
|
Root MSE++ |
754.1 |
1.80 |
10.3 |
6.70 |
0.30 |
0.104 |
|
|
CV, % |
183.8 |
48.0 |
32.0 |
30.3 |
8.92 |
14.1 |
|
|
*: P<0.05, **: P<0.01, ***: P<0.0001. + All abbreviations and units as mentioned in Table 2 ++ Root mean-square error |
|||||||
Analysis of variance shows that MOR and DIM has highly significant (P<0.01 or 0.001) effects on all studied traits. The coefficient of determination (R2) varied from 4% (for SCC) to 84% (for PY). In general, the magnitude of the effect of these factors including in the models in SCC, SCS and MUN was small. Only 4.0, 7.0 and 18.0% of the variation in SCC, SCS and MU values, respectively were explained by the factors studied. It is clear that there are other sources that account for most of the variation in SCC and MUN (including nutritional factors) which were not included in this study. Arunvipas et al (2004) reported that only 18.9% of the variation in bulk tank MUN values was explained by the seasonal pattern and year of study. Stoop et al (2007) stated that, in general, the magnitude of the effect of non-nutritional factors (DIM, Age at first calving, season of calving, herd) in MUN was small. Only 13.3% of the variation in MUN values was explained by the factors they studied.
Coefficient of variation (CV %) varied from 8.92% (for PP) to 183.8% (for SCC) (Table 4). Similar trends were found by Rekik et al (2008) who reported that TDM, PY, and SCS were significantly affected by herd-test-day date, herd-calving year, calving to test-day interval, calving age, and calving to conception interval in the first and second lactations. The R2 varied from 41% to 69% for the studied traits, with SCS having the lowest R2 coefficients in all three lactations. Rodriguez-Zas et al (2000) analyzed 2387 SCS records from 217 Holsteins and found that average SCC and standard deviation was 671,000 and 897,000 cells/ml, respectively. They added that a few cows, with clinical mastitis symptoms, have very high levels of SCS, causing the average to be higher than the values usually associated to minor pathogens. Very high standard deviation for SCC was reported also by Ng-Kwai-Hang et al (1985) who found that SCC in terms of thousands per milliliter of milk was the most variable component with an overall mean of 297 and a standard deviation of more than twice this. The R2 for the GLM procedure that examined the relationship between the variables and MU was 0.47 using a large database (n = 1,279,600). The differences in the values of R2 and CV% may be due to the different statistical analysis, breed, number of observations and/or fixed effects included in the statistical model.
Least squares means and standard errors of SCC, SCS, MU, TDM, PP and PY distributed monthly according to MOR and adjusted for the other factors included in the model are presented in Table 5 and Figures 1 a and b.
|
Table 5.
Least squares means (LSM) and standard errors (SE) of somatic cell
count (SCC, 1000 cell/ml), somatic cell score (SCS), test-day, Milk yield (TDM, kg), |
||||||||||||||
|
MOR |
Observations |
Trait |
||||||||||||
|
No. |
% |
SCC |
SCS |
MU |
TDM |
PP |
PY |
|||||||
|
LSM |
SE |
LSM |
SE |
LSM |
SE |
LSM |
SE |
LSM |
SE |
LSM |
SE |
|||
|
January |
2762 |
8.66 |
365a |
19.4 |
3.75a |
0.046 |
34.1adf |
0.26 |
20.7a |
0.18 |
3.45ab |
0.008 |
0.766a |
0.003 |
|
February |
3324 |
10.43 |
335a |
17.3 |
3.57a |
0.041 |
29.1e |
0.24 |
22.9bd |
0.16 |
3.46a |
0.007 |
0.785b |
0.002 |
|
March |
2593 |
8.13 |
398a |
18.4 |
3.74a |
0.044 |
25.2 |
0.25 |
22.9bc |
0.17 |
3.43bc |
0.008 |
0.774a |
0.003 |
|
April |
2406 |
7.55 |
384a |
20.5 |
3.58a |
0.049 |
31.3 |
0.28 |
22.3cd |
0.19 |
3.37 |
0.009 |
0.761a |
0.003 |
|
May |
2650 |
8.31 |
393a |
17.3 |
3.73a |
0.041 |
36.1a |
0.24 |
22.1e |
0.16 |
3.45ad |
0.007 |
0.773a |
0.002 |
|
June |
3514 |
11.02 |
408ad |
15.5 |
3.78a |
0.037 |
33.9adh |
0.21 |
23.1bdf |
0.14 |
3.40 |
0.007 |
0.764 |
0.002 |
|
July |
3017 |
9.46 |
420bd |
17.3 |
3.75a |
0.041 |
33.3bfh |
0.23 |
22.1g |
0.16 |
3.37 |
0.007 |
0.754c |
0.002 |
|
August |
3016 |
9.46 |
495cf |
17.0 |
4.00b |
0.040 |
29.7e |
0.23 |
22.2h |
0.15 |
3.27 |
0.007 |
0.742 |
0.002 |
|
September |
3502 |
10.98 |
504cf |
16.0 |
3.91b |
0.038 |
34.2ab |
0.21 |
19.9k |
0.15 |
3.37 |
0.007 |
0.751c |
0.002 |
|
October |
40 |
0.13 |
420abf |
124.2 |
3.62a |
0.296 |
32.5abce |
1.72 |
22.7a |
1.12 |
3.45cdh |
0.051 |
0.800d |
0.017 |
|
November |
3131 |
9.82 |
358a |
16.0 |
3.59a |
0.038 |
32.5c |
0.21 |
23.4kd |
0.15 |
3.56f |
0.007 |
0.805d |
0.002 |
|
December |
1926 |
6.04 |
320a |
21.8 |
3.50a |
0.052 |
33.6bd |
0.30 |
21.0a |
0.20 |
3.52fh |
0.009 |
0.781bd |
0.003 |
|
* Values with the same superscript (within a column) show no statistically significant difference at P> 0.05 |
||||||||||||||
|
|
|
|
|
|
Effect of MOR on SCC measures
Generally, SCC was high during summer and fall seasons reached 408, 420, 495, 504 and 420, cell x 1000/ml for June, July, August, September and October, respectively. Meanwhile, SCC were low during winter and spring seasons reached 320, 365, 335, 398 and 384 cell x 1000/ml for December, January, February, March and April, respectively. The SCC reached the maximum level in September (504,000 cell/ml) associated to the lowest TDM (19.9 kg). The SCS followed the same trend of the SCC where maximum SCSs were in August (4.00) and September (3.91) and minimum SCSs were in December (3.50) and February (3.57) (Table 5 and Figure 1a). Reents et al 1995 reported high SCS for the summer season. In addition, Coulon et al (1996) analyzed 404 lactations of 208 dairy cows managed on an INRA Experimental Farm and found that SCC increased slightly during summer, independently of lactation stage. Rodriguez-Zas et al (2000) analyzed 2387 SCS records from 217 Holsteins and found that lactations starting between October and December had the highest fall of SCS levels at the beginning of lactation, and the smallest increases thereafter. These results in close agreement with the present results. Contrary, Rekik et al (2008) reported that the calving season had no effects on SCS levels even though the summer season in Tunisia is characterized by its high temperature–humidity index.
Effect of MOR on Mu
Concentrations of MU were significantly (P<0.001) associated with MOR (Table 5 and Figure 1b). The MU were at its highest levels in May and September (least squares means = 36.1 and 34.2 mg/dl, respectively) and the lowest levels in February and March (least squares means = 29.1 and 25.2 mg/dl, respectively). There was significant difference between the highest and the lowest values in MU estimates by 10.9 mg/dl (30.2 %). Several other researchers have reported high MUN during the summer (Ng-Kwai-Hang et al 1985; Carlsson et al 1995; Ferguson et al 1997; Godden et al 2001a,b; Rajala-Schultz and Saville 2003; Hojman et al 2004, 2005; Miglior et al 2006 and Stoop et al 2007). The present results in good agreement with the several previous studies. For example, Ng-Kwai-Hang et al (1985) studied the seasonal (monthly) variation of protein and non-protein nitrogenous (NPN) content of individual cow milk. They found that NPN content was lowest in March (28 ml/100 ml) and tended to increase until October before dropping. Ferguson et al (1997) reported that MU varied by season as follows: winter, 5.00 ± 0.071; spring, 5.35 ± 0.075; summer, 5.83 ± 0.086; fall, 5.07 ± 0.093. In addition, Godden et al (2001a) found that concentrations of MUN were highest from July to September and during the late summer season (July to September). Calberry (2003) stated that MUN concentrations may also increase in the spring as pastures become available. Rajala-Schultz and Saville (2003) showed that MUN concentrations were highest during summer and significantly lower in winter, spring and fall (2.5, 1.8, and 2.8 mg/dl lower than in summer, respectively). In the high producing herds, the differences among seasons were much smaller, but significant for winter and spring and in fact, MUN concentrations were lowest during summer. They added that higher MUN values in summer in these herds could, however, be explained by cows having access to fresh pasture, which typically contains highly degradable protein and has high protein/energy ratio. This could also partially explain the high proportion of variability in MUN explained at test day level among these low producing herds. Hojman et al (2004, 2005) reported that MU was significantly associated with month of the year; it was higher during the spring and summer months and lower in the cold season. Miglior et al (2006), on Holstein cows, found that MUN concentration tended to be lower in winter and early summer, and higher in spring, late summer, and fall. Stoop et al (2007) stated that the highest MUN values occurring in July and August. The total protein and true protein (mostly casein) in milk are lower during the summer months, while NPN, which includes urea, increases (Van Soest 1994; Carlsson et al 1995 and Ferguson et al 1997).
The variation in MU concentration may be attributed to changes in pasture protein and energy components from season to another. Australian spring pasture contained 20 to 30% crude protein but only 5 to 20% soluble carbohydrate. Thus, conditions were created for a high protein:energy ratio, which could result in elevated urea concentrations (Moller et al 1993). However, other seasonally related factors that may contribute to the association between season and MU could include ambient temperature, humidity, and water intake (Godden et al 2001b). Lower MUN concentrations in summer than in winter and spring for high producing herds could be related to lower dry matter intake due to the heat and thus lower protein intake in summer (Rajala-Schultz and Saville 2003). The seasonal variation in MU also may be attributed to feed changes associated with season, such as the use of corn silages, fresh silage, and pasture, are likely to influence MUN values as reported by Arunvipas et al (2004). They added that during the pasture season, herds had a higher bulk tank-MUN than during the non-pasture period, particularly during the mid and late pasture season.
Effect of MOR on milk production traits
Test-day milk yield, PP and PY were significantly (P<0.001) associated with MOR (Table 5 and Figures 1a and b). It could be noticed, in general, that milk production traits (TDM, PP and PY) in its highest levels in fall (November) and in its lowest levels in summer months (August and September). Least squares means of TDM, adjusted for the other factors, during September month the lowest (19.9 kg/day) comparing with the other months. Test-day milk yield increased to the maximum level in November (23.4 kg/day). Milk protein yield followed the same trend of TDM where the highest PY level was in November (0.805 kg/day) followed by October (0.800 kg/day) and the lowest PY was in August (0.742 kg/day) followed by September (0.751 kg/day). Generally, PY was high during the months of fall (October-December) ranged between 0.781 to 0.805 kg/day and low level during the summer months (July-September) ranged between 0.742 to 0.754 kg/day. Milk protein percent was in its highest level in November (3.56%) and the lowest level in August (3.27%). Ng-Kwai-Hang et al (1985) noticed that seasonal (monthly) variation of protein and NPN content of individual cow milk were high in January, decreased gradually reaching minimum in July, after which they increased to peak in October.
Least squares means of SCC, SCS, MU, milk production traits (TDM, PP and PY) as affected by DIM categories are given in Table 6 and Figures 2 a and b.
|
Table 6.
Least squares means
(LSM) and standard errors (SE) of somatic cell count (SCC, 1000
cell/ml), somatic cell score (SCS),
test-day milk yield (TDM, kg), |
|||||||||||||||
|
C |
DIM, day |
Observations |
Trait |
||||||||||||
|
No. |
% |
SCC |
SCS |
MU |
TDM |
PP |
PY |
||||||||
|
LSM |
SE |
LSM |
SE |
LSM |
SE |
LSM |
SE |
LSM |
SE |
LSM |
SE |
||||
|
≤30 |
2693 |
8.45 |
444a |
21.9 |
3.65a |
0.05 |
29.7a |
0.30 |
24.2ac |
0.20 |
3.28a |
0.009 |
0.749 |
0.003 |
|
|
2 |
31-60 |
3185 |
10.0 |
465a |
20.4 |
3.60aB |
0.05 |
30.0a |
0.28 |
26.2b |
0.19 |
3.19 |
0.008 |
0.737a |
0.003 |
|
3 |
61-90 |
3500 |
10.98 |
467a |
19.6 |
3.69a |
0.05 |
31.1c |
0.27 |
25.7b |
0.18 |
3.25a |
0.008 |
0.746a |
0.003 |
|
4 |
91-120 |
3466 |
10.88 |
469a |
19.3 |
3.76a |
0.05 |
32.3b |
0.26 |
24.3a |
0.18 |
3.34 |
0.008 |
0.765b |
0.003 |
|
5 |
121-150 |
3282 |
10.3 |
442a |
19.4 |
3.76a |
0.05 |
32.6b |
0.26 |
23.5c |
0.18 |
3.41 |
0.008 |
0.778b |
0.003 |
|
6 |
151-180 |
3007 |
9.44 |
421a |
19.8 |
3.77a |
0.05 |
33.1b |
0.27 |
22.1 |
0.18 |
3.45 |
0.008 |
0.783bcef |
0.003 |
|
7 |
181-210 |
2898 |
9.10 |
395a |
20.1 |
3.79aC |
0.05 |
33.3b |
0.27 |
21.0 |
0.18 |
3.50b |
0.008 |
0.791cd |
0.003 |
|
8 |
211-240 |
2897 |
9.09 |
342 |
20.3 |
3.72a |
0.05 |
33.1b |
0.28 |
20.0d |
0.18 |
3.53b |
0.008 |
0.792de |
0.003 |
|
9 |
241-270 |
2726 |
8.56 |
316 |
20.9 |
3.75a |
0.05 |
33.4b |
0.28 |
18.5 |
0.19 |
3.59 |
0.008 |
0.789d |
0.003 |
|
10 |
271-300 |
2343 |
7.35 |
309 |
22.0 |
3.73a |
0.05 |
33.0b |
0.30 |
17.7 |
0.20 |
3.61 |
0.009 |
0.778f |
0.003 |
|
11 |
> 300 |
1866 |
5.86 |
327 |
23.4 |
3.60a |
0.06 |
31.6bc |
0.32 |
20.1d |
0.21 |
3.53b |
0.010 |
0.774b |
0.003 |
|
a-f, Least squares Means within the same column with similar superscript are not significantly (P>0.05) different B and C, Least squares Means within the same column with capital superscript are significantly (P<0.05) different |
|||||||||||||||
|
|
|
|
|
|
Effect of DIM on SCC measures
Somatic cell count slight increased in the first four months of lactation (444, 465, 467 and 469 cell x 1000/ml, respectively) then declined gradually to the end of lactation (decreased from 442,000 in the fifth month to 309,000 cell /ml in the tenth month of lactation). The gradual increase in SCC in months 2, 3 and 4 of lactation was only two millions cell/ml. least square mean of SCS in the first month of lactation was 3.65 slightly decreased to 3.60 in the 2nd month then increased gradually from the 3rd month (3.69) to reach the maximum in the 7th month (3.79) then declined to the end of lactation (3.6) (Table 6 and Figure 2a). The range between the maximum and minimum value of SCC was 160,000 cell/ml (34% of the maximum value). Similar results were found by Spicer et al (2000) who reported that weekly SCC did not change (P>0.1) between week 1 and 12 of lactation and averaged 430,000 ± 157,000. Wiggans and Shook (1987) noticed that after the beginning of lactation, SCS decreases to a minimum at around 60 days post-calving and increases thereafter. Other studies also (Bodoh et al 1976; Kennedy et al 1982 and Emanuelsson and Persson 1984) reported that stage of lactation has an effect on sample day SCC, and SCC declines rapidly until the 2nd month of lactation before slowly rising to dry off. These results are in good agreement with those of the present study. Variation in the shape and level of the SCS pattern is related to lactation number (Wiggans and Shook 1987), to udder infection status (Sheldrake et al 1983) and to individual cows (Rodriguez-Zas et al 2000). Atakan (2008) and Rekik et al (2008) confirmed the significant effect of DIM on SCC measures reported in the present study also. Atakan (2008) stated that lactation month had a significant (P < 0.01) effect on SCC in milk. Rekik et al (2008) also found that days in milk, calving age, and calving to conception interval were all together important sources of variation (p<0.05) for SCS. On the other hand, Coulon et al (1996) studied the changes in somatic cell count in 404 lactations of 208 dairy cows and found that on average, SCC was minimal in the second month of lactation (50,000 cells/ml) and maximal in late lactation (200,000 cells/ml). It is worth to mention that only lactations free of clinical mastitis were included in the study of Coulon et al (1996). Wicks and Leaver (2006) found that there was an increase in monthly SCC with increasing stage of lactation in Holstein-Friesian cows. They attributed the fall in SCC during the first three months of lactation probably to a dilution effect as daily milk yield increased towards peak. The progressive rise from 3 months to the end of lactation may be attributed to increased somatic cells and decreased daily milk yield. In Canada, Dürr et al (2008) concluded that daily milk losses caused by changes in LnSCC depend on breed, parity and stage of lactation, and ignoring these factors leads to significant errors in estimating losses associated to subclinical mastitis.
Effect of DIM on Mu
The MU increased steadily with advancing of lactation period until the 7th month of lactation reached 33.3±0.27 mg/dl. The concentration of MU was significantly (P<0.001) lower during the first 30-DIM category (29.7±0.30 mg/dl) compared with all other DIM categories except for MU concentration in the 2nd month of lactation (30.0±0.28 mg/dl) the difference was not significant. From the results given in Table 6 and Figure 2b, it could be noticed that the MU during the early lactation (first 90-days) were lower (ranged between 29.7 to 31.1 mg/dl) than that of the mid location (90-210 days) (ranged between 32.3 to 33.3 mg/dl). In addition, the differences in MU among the months from 4th to 10th were not significant. A number of studies (Carlsson et al 1995; Spicer et al 2000; Godden et al 2001a,b; Johnson and Young 2003; Rajala-Schultz and Saville 2003; Wood et al 2003; Hojman et al 2004, 2005 and Stoop et al 2007) reported significant effects of DIM on MUN, but the direction of the effect was inconsistent.
Many studies have reported lower MUN during the first month of lactation than later (Bruckental et al 1980; DePeters and Ferguson 1992; Emanuelson and Wiktorsson 1993; Carlsson et al 1995; Arunvipas et al 2003, 2004 and Stoop et al 2007). However, Faust et al (1997) and Schepers and Meijer (1998) found no variation in MUN by stages of lactation. Rajala-Schultz and Saville (2003) noticed that MUN concentrations in Ohio dairy herds were lowest during the first month of lactation. Johnson and Young (2003) found that MUN concentrations were lower during the first 30 DIM compared with all other DIM categories for both Holstein and Jersey cows. They added that although it can be speculated that the lower MUN concentrations might be related to lower dry matter intake or possibly consumption of a ration with a different composition than after 30 DIM. Similar results were found also by Arunvipas et al (2003) who reported that The MUN was lower during the first month of lactation. This observation agrees with the finding of the present study. The present findings are also in accordance with reports by Carlsson et al (1995) who found that MU was lowest immediately after calving, increased, reached a maximum between 3 and 6 mo of lactation, and then slowly declined. Similar results were found also by Spicer et al (2000) who noticed that MU increased (P<0.05) during early lactation, plateauing after wk 3. They concluded that week of lactation should be considered when interpreting MUN values. Godden et al (2001a) found that concentrations of MUN were highest in cows between 60–150 days in milk. Milk urea nitrogen was lowest in first lactation cows as well as cows in their first 60 days in milk or after 150 days in milk. Wood et al (2003) found that herd-test-day effects had the most significant impact on MUN. They added that effects of stage of lactation were also important, and MUN levels tended to increase from the time of peak yield until the end of lactation. Hojman et al (2004) noticed that on the second monthly test day, MU concentration was at its lowest level (least squares mean = 13.5 mg of MUN/dL). From then on, MU level progressively increased until 300 DIM (least squares mean = 14.7 mg of MUN/dL) and then leveled off and decreased toward the end of lactation. The same authors (Hojman et al 2004) in another study (Hojman et al 2005) found a positive association between DIM and MU concentration and stated that MU is lowest immediately after calving, increases to a maximum concentration between the 3rd and 6th months of lactation, and then slowly declines. Stoop et al (2007) found a peak between the second and third month of lactation and a slight decrease in MUN with advancing DIM. The previous results in good agreement with those reported in the present study.
Changes in ration nutrient composition or feeding programs that occur among different stages of lactation could contribute to the variation observed in MU. There may also be physiological differences that could affect MU. For example, rumen microbial adaptation, and rumen absorptive capacity could contribute to differences in MU at different stages of lactation (Godeen et al 2001a). On the other hand, Schepers and Meijer (1998) found no association between stage of lactation and MU when feeding trials were controlled for nutritional factors. However, the authors stated that because the nutritional variables they looked at were not statistically independent, the effect of DIM was probably included indirectly through the nutritional factors. This suggests that non-nutritional factors are of minor importance in explaining the association between MU and stage of lactation. Carlsson et al (1995) observed the same with cows that were housed inside (i.e., were not grazing), especially high producing cows have difficulty in meeting their requirements for energy, and they are in a negative energy balance at the beginning of lactation (Carlsson et al 1995). Lower MUN concentrations at the beginning of lactation could be related to and explained by the inability of cows to ingest sufficient amount of feed, which could lead to, or be result of, suboptimal function of the ruminal flora (Carlsson et al 1995).
Effect of DIM on milk production traits
Least squares means and standard errors of TDM, PP and PY by DIM are given in Table 6 and illustrated in Figure 2a. Test-day milk yield reached the peak in the 2nd month of lactation (26.2±0.19 kg) then decreased gradually to the end of lactation. Protein percentage followed opposite trend to that of TDM, where PP declined to the lowest level in the second month of lactation (3.19 ± 0.008%) then increased gradually and steadily to the end of lactation. This reversible trend between TDM and PP reflect the known negative relationship between them. Protein yield followed the same trend of PP ranged between 0.737 kg (2nd month) to 0.792 kg (8th month) with no significant changed between most months of lactation.
Effects of DIM on milk yield are well documented. In general, daily milk yield increases to peak a few weeks after calving (the 2nd month of lactation) and then gradually declines to dry off. Such a trend is exactly what one would expect from the study of the lactation curve (milk yield increases up to a peak and then decreases steadily up to the end of the lactation). Wood (1976) found that fat and protein percentages declined to a trough early in lactation (wk 8 and 11 for fat and protein percentage, respectively) and then gradually increased to dry off. Fat and protein yields reached an early peak (by wk 3) and then declined but more slowly than did milk. Similar results were found also by several studies. Spicer et al (2000) found that milk protein level decreased (P<.05) between wk 1 and 3 postpartum and remained constant between wk 4 and 12.
Least squares means and standard errors of TDM, PP and PY by somatic cell score categories are given in Table 7 and Figures 3a and b.
|
Table 7.
Least squares means (LSM) and standard errors (SE) of milk urea
content (MU, mg/dl), test-day milk yield |
|||||||||||
|
C |
SCS |
Observations |
Trait |
||||||||
|
No. |
% |
MU |
TDM |
PP |
PY |
||||||
|
LSM |
SE |
LSM |
SE |
LSM |
SE |
LSM |
SE |
||||
|
|
|||||||||||
|
1 |
0-3 |
10249 |
46.26 |
33.2 |
0.18 |
23.2a |
0.12 |
3.37a |
0.01 |
0.769a |
0.002 |
|
2 |
4 |
4664 |
21.05 |
32.6a |
0.21 |
22.4b |
0.14 |
3.41b |
0.01 |
0.773a |
0.002 |
|
3 |
5 |
3291 |
14.86 |
32.2a |
0.23 |
22.0bf |
0.16 |
3.42b |
0.01 |
0.771a |
0.002 |
|
4 |
6 |
2001 |
9.03 |
31.9a |
0.27 |
21.8cf |
0.18 |
3.43b |
0.01 |
0.768a |
0.003 |
|
5 |
7-9 |
1948 |
8.79 |
30.6 |
0.28 |
21.2c |
0.18 |
3.48c |
0.01 |
0.775a |
0.003 |
|
* Least squares Means within the same column with similar superscript are not significantly (P>0.05) different |
|||||||||||
|
|
|
|
|
|
On contrast, least squares means and standard errors of SCC and SCS by TDM categories are given in Table 8 and Figures 4a and b.
|
Table 8.
Least squares means
(LSM) and standard errors (SE) of somatic cell count (SCC, 1000
cell/ml), somatic cell score (SCS), milk urea content |
|||||||||||||
|
C |
TDM, |
Observations |
Trait |
||||||||||
|
No. |
% |
SCC |
SCS |
MU |
PP |
PY |
|||||||
|
LSM |
SE |
LSM |
SE |
LSM |
SE |
LSM |
SE |
LSM |
SE |
||||
|
1 |
≤15 |
6170 |
19.36 |
570 |
16.7 |
4.25 |
0.04 |
26.9 |
0.22 |
3.55 |
0.01 |
0.407 |
0.002 |
|
2 |
>15-20 |
6805 |
21.36 |
405a |
16.0 |
3.74 |
0.04 |
29.2a |
0.21 |
3.48 |
0.01 |
0.624 |
0.002 |
|
3 |
>20-25 |
7342 |
23.04 |
366ab |
15.5 |
3.58a |
0.04 |
31.6a |
0.21 |
3.42 |
0.01 |
0.773 |
0.002 |
|
4 |
>25-30 |
5775 |
18.12 |
328b |
16.9 |
3.49a |
0.04 |
34.0a |
0.23 |
3.37 |
0.01 |
0.913 |
0.002 |
|
5 |
>30 |
5771 |
18.11 |
330b |
17.4 |
3.49a |
0.04 |
38.9 |
0.24 |
3.31 |
0.01 |
1.139 |
0.003 |
|
* Least squares Means within the same column with similar superscript are not significantly (P>0.05) different |
|||||||||||||
|
|
|
|
|
|
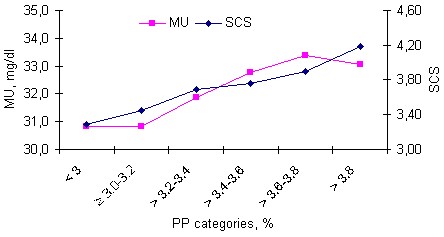
Least squares means and standard errors of SCC and SCS by PP categories are given in Table 9 and Figures 5a and b.
|
Table 9.
Least squares means
(LSM) and standard errors (SE) of somatic cell count (SCC, 1000
cell/ml), somatic cell score (SCS), milk urea content |
|||||||||||
|
C |
PP, % |
Observations |
Trait |
||||||||
|
No. |
% |
SCC |
SCS |
MU |
TDM |
||||||
|
LSM |
SE |
LSM |
SE |
LSM |
SE |
LSM |
SE |
||||
|
1 |
< 3.0 |
4354 |
13.66 |
267a |
19.1 |
3.28 |
0.05 |
30.8a |
0.27 |
24.7a |
0.18 |
|
2 |
≥3.0-3.2 |
6041 |
18.96 |
310a |
16.7 |
3.45 |
0.04 |
30.8a |
0.23 |
24.6a |
0.16 |
|
3 |
>3.2-3.4 |
7167 |
22.49 |
382b |
15.6 |
3.69a |
0.04 |
31.9 |
0.21 |
23.0 |
0.14 |
|
4 |
>3.4-3.6 |
6500 |
20.40 |
410bc |
16.0 |
3.76ab |
0.04 |
32.8b |
0.22 |
21.5 |
0.15 |
|
5 |
>3.6-3.8 |
4307 |
13.52 |
454c |
17.9 |
3.90b |
0.04 |
33.4bc |
0.24 |
20.3 |
0.16 |
|
6 |
>3.8 |
3494 |
10.97 |
577 |
19.2 |
4.18 |
0.05 |
33.1c |
0.26 |
18.6 |
0.17 |
|
* Least squares Means within the same column with similar superscript are not significantly (P>0.05) different |
|||||||||||
|
|
|
|
|
|
Test-day milk yield was unfavourably affected by high SCS recorded in the same test-day. Test-day milk yield, adjusted for the other variables, significantly (P<0.001) decreased from 23.2±0.12 kg in the first SCS category (SCS 0-3, considered uninfected cows with mastitis) to 21.2±0.08 kg in the fifth (last) SCS category (SCS 7-9 considered clinically infected cows with mastitis). This range between the first and the last SCS categories in TDM equal 2 kg milk in test-day milking and represents 8.62% of the highest category (Table 7). Meanwhile, PP, adjusted for the other variables, significantly (P<0.001) increased from 3.37±0.01 to 3.48±0.01%, for the 1st and last SCS categories, respectively. Direct losses in milk and protein yields from increased SCS are important. The negative relationship between SCS and milk yield has been referred to as "milk loss". Another explanation concerning the negative relationship between milk yield and SCC hypothesize that part of the decrease of the milk production is due to increased demand for energy of the immune system against the infection, decreased appetite associated with any inflammation and lowered food intake due to pain and decreased movements. These results are in accordance with findings of Raubertas and Shook (1982); Jones et al (1984); Fetrow et al (1991) and Rekik et al (2008). Raubertas and Shook (1982) estimated that each unit increase in lactation SCS was associated with losses of 91 and 181 kg of milk during parities 1 and 2, respectively. Fetrow et al (1991) found that the effect of increased SCC during second lactation on third-lactation milk yield was significant (P<0.04) but only 20 to 30% as large as the direct effect of SCC during third lactation. Rekik et al (2008) found that TDM was unfavourably affected by high SCS recorded in the same test-day and the reduction in milk production from increased SCS varied from 0.23 to 1.76 kg. Additionally, Miller et al (2004) reported that the relationship between milk yield and SCC might overestimate true milk loss due to mastitis. They added that three important aspects concerning interpretation of the relationship between milk yield and SCC are: 1) interpretation of variation among SCC at low levels, 2) presence of a “dilution effect” because of relatively constant SCC throughout lactation if no infection is present, and 3) compensation by uninfected quarters for mastitic quarters. Some studies also showed that the increased SCS before first service affects negatively leutinizing hormone (LH) pulses, which may delay ovulation (Barker et al 1998). Likewise, increased SCS because of mastitis infection may increase prostaglandin hormone (PGF2α) concentration leading to abortion and consequently lengthens the interval between calving and conception (Barker et al 1998). Furthermore, milk with high SCC has its coagulation properties compromised and the efficiency of cheese production reduced (Ikonen et al 2004).
Table 7 shows that, from 22153 test-day records, 10249 (46.3%) were uninfected (less than 140,000 cell/ml), meanwhile, 1948 test-day records (8.79%) were infected (more than 1,130,000). The intermediate scores between the two groups (categories 2, 3 and 4) represent the rest of the test-day records (44.9%), in spite of Jones et al (1984) pointed out that the data of Dairy Herd Improvemenmt (DHI) suggest that SCC of 200 to 400 cell x1000/ml are associated with lower milk yields and greater infection rates. Koivula et al (2005) considered that cows have scores greater than 5.5 (560,000 cells/ml), are clinically infected. Also, Ruegg et al (2008) using the data of DHI, suggested that quarters with SCC ≥ 200,000 cells/ml at both dry-off and post-calving are at DIM proportion of cows without a clinical case greater risk for clinical mastitis and are more likely to be subclinically infected at the first DHIA test of the subsequent lactation. By comparing herd somatic cell values to benchmark values, producers can identify problems and set goals for improvement. Therefore, tests for the detection of mastitis should be set up for cattle herds, especially the genetic correlations between clinical mastitis and SCS are greater than 0.60 (Carlén et al 2004 and Koivula et al 2005).
On the other hand, monitoring SCC and SCS by TDM (Table 8) and PP (Table 9) categories, there are linear and negative relationships between TDM and each of SCC and SCS. From Table 8, It could be noticed that with increasing TDM categories from 1-5, SCC significantly (P<0.01) decreased from 570±16.7 in the first category (≤15 kg/TDM) to 330±17.4 cell x1000/ml in the fifth (last) category (>30 kg/TDM). The range between the first and the last TDM categories in SCC equal 240 cell x 1000/ml milk and represents 42% the highest category. This means that with increasing SCC in milk, TDM in the same milking decrease. SCS followed the same trend of SCC, where SCS decreased from 4.25±0.04 to 3.49±0.04 in the first and fifth TDM categories, respectively. This range between the first and the last TDM categories in SCS equal 0.76 and represents 17.9% of the highest category (Table 8).
>From Table 9, it could be noticed that there are linear and positive relationships between PP and each of SCC or SCS in the same milking. Test-day milk with less than 3% PP (first PP category) had only 267±19.1 cell x1000/ml SCC and 3.28±0.05 SCS, meanwhile test-day milk with > 3.8% PP (sixth or last category) had 577±19.2 cell x1000/ml SCC and 4.18±0.05 SCS. The range between the two categories in SCC was 310 cell x 1000/ml and represents 53.7% of the highest category. Some studies (Shuster et al 1991; Auldist et al 1995 and Auldist and Hubble 1998) reported that during mastitis, there is an increase in milk proteins and that has been attributed to the influx of blood-borne proteins (such as serum albumin, immunoglobulins, the minor serum proteins, transferring ά-macroglobulin into the milk coupled with a decrease in caseins. According to Auldist et al (1995) and Auldist and Hubble (1998), this increase in proteins of blood serum origin during mastitis is possibly due to a disruption to the integrity of the mammary epithelia by microbial toxins and opening of the tight junctions. Auldist and Hubble (1998) continue that the decrease in casein concentrations during mastitis is largely due to post-secretory degradation of casein by proteinases originating from mastitis-causing organisms, leucocytes or the blood and in part to a reduction in the synthesis and secretion of casein because of physical damage to the mammary epithelial cells by microbial toxins during mastitis. Wicks and Leaver (2006) found that in cows of greater than parity two, a negative correlation between actual milk production and SCC showed that SCC declined as milk yield increased. This decrease in SCC with milk production may not represent a change in the number of cells shed, but a dilution effect (Miller et al 1983) or alternatively as a result of mastitis, and the inflammatory responses associated with mastitis, the secretion and removal of milk from the ducts is impaired (Dodd and Booth 2000). Heuven et al (1988) showed also that where SCC was considered as a concentration of cells (i.e., cells per millilitre), the correlation between SCC and milk production was negative, supporting the current results, and the dilution effect theory. They also found that the phenotypic correlation between milk production and SCC (as the total number of cells shed) was positive. This indicates that more cells are shed, with increasing milk production. Whether the increase in cells shed with increasing milk yield was indicative of an increased mastitis incidence or due to a higher rate of turnover of cells within glands, producing greater quantities of milk is uncertain. Pryce et al (1998) also reported a negative phenotypic correlation between milk production and SCC.
Least squares means and standard errors of MU by TDM categories are given in Table 8 and Figure 4b and by PP categories are given in Table 9 and Figure 5b. On contrast, least squares means and standard errors of TDM, PP and PY by MU categories are given in Table 10 and Figures 6a and b.
|
Table 10.
Least squares means (LSM) and standard errors (SE) of somatic cell
count (SCC, 1000 cell/ml), somatic cell score (SCS),
test-day milk yield (TDM, kg), |
|||||||||||||
|
C |
MU, Mg/dl |
Observations |
Trait |
||||||||||
|
No. |
% |
SCC |
SCS |
TDM |
PP |
PY |
|||||||
|
LSM |
SE |
LSM |
SE |
LSM |
SE |
LSM |
SE |
LSM |
SE |
||||
|
1 |
<15 |
1492 |
4.68 |
546 |
28.1 |
4.10 |
0.07 |
16.7 |
0.25 |
3.38a |
0.011 |
0.733 |
0.004 |
|
2 |
15- 25 |
7842 |
24.61 |
445a |
14.6 |
3.84a |
0.03 |
18.9 |
0.13 |
3.40a |
0.006 |
0.749 |
0.002 |
|
3 |
26- 35 |
11743 |
36.85 |
420a |
13.3 |
3.77a |
0.03 |
21.2 |
0.12 |
3.43b |
0.006 |
0.763 |
0.002 |
|
4 |
36- 45 |
7098 |
22.28 |
348b |
15.1 |
3.58b |
0.04 |
22.8 |
0.14 |
3.44b |
0.006 |
0.770 |
0.002 |
|
5 |
46- 55 |
2499 |
7.84 |
333b |
20.3 |
3.60b |
0.05 |
24.5 |
0.19 |
3.45b |
0.008 |
0.783 |
0.003 |
|
6 |
> 55 |
1189 |
3.73 |
307b |
26.7 |
3.38 |
0.06 |
28.6 |
0.24 |
3.46b |
0.011 |
0.828 |
0.004 |
|
* Least squares Means within the same column with similar superscript are not significantly (P>0.05) different |
|||||||||||||
>From these tables, it could be noticed that there are positive relationships between MU and milk production traits. The lowest TDM category (≤15 kg) had the lowest MU (26.9 Mg/dl), meanwhile the highest TDM category (>30 kg) had the highest MU (38.9 Mg/dl) (Table 8). The lowest PP category (< 3.0%) had the lowest MU (30.8 Mg/dl), meanwhile the PP category between 3.6 to 3.8% had the highest MU (33.4 Mg/dl) (Table 9). The lowest MU category (<15 Mg/dl) had the lowest TDM (16.7 kg) and PP (3.38%), meanwhile the highest MU category (> 55 Mg/dl) had the highest TDM (28.6 kg) and PP (3.46%) (Table 10). The positive relationships between MU and milk traits were found also by several authors (Oltner et al 1985; Gustafsson and Palmquist 1993; Butler et al 1995; Carlsson et al 1995 and Hojman et al 2004 and 2005), whereas others have found a negative relationship (Ismail et al 1996; Broderick and Clayton 1997 and Johnson and Young 2003) or no association between them (Baker et al 1995; Godden et al 2001 and Rajala-Schultz and Saville 2003). Eicher et al (1999) found the associations between MUN or milk protein percentage with respect to production factors such as DIM, parity and milk production, considerably varied among dairy herds. Godden et al (2000a) found a positive nonlinear association between cow-level MUN and milk yield and a negative nonlinear association between MUN and milk fat and protein percentage and a significant negative nonlinear association with somatic cell linear score. Johnson and Young (2003) found that MUN was inversely associated with milk protein percentage and paralleled change in milk yield over time.
The conflicting findings among various studies regarding the relationship between MU and milk yield might have several explanations. An explanation for a positive relationship between MU and production is that higher protein feeding, associated with higher MU concentrations, also supports higher milk production (Oldham 1984). This may be due to a combination of factors including greater amino acid availability for milk protein synthesis, improved availability of energy through deamination of amino acids, improved efficiency of utilization of absorbed nutrients, or improved dry matter intake (Macleod et al 1984; Oldham 1984). Conversely, an explanation for a negative relationship between MU and production is that the energy tax associated with the conversion of excess amounts of ammonia to urea may contribute to lower available energy for milk production (Nelson 1996). The conversion of ammonia to urea in the liver has been estimated to cost the animal 12 Kcal/g of excess nitrogen excreted (Van Soest 1994). Vandehaar (1998) predicted that if a cow producing 45 kg of milk/d and eating 25 kg of dry matter/day required 17% crude protein (CP) in its diet, then feeding an extra two percentage points of protein (a diet of 19% CP) would amount to an energy expense of 0.36 Mcal/day. Other factors influencing the relationship between MU and production could include the type and quality of dietary protein provided, including amino acid availability. While MU concentration may be sensitive to levels of crude protein, rumen degradable protein and rumen undegradable protein, it has been reported not to be associated with amino acid balance (Baker et al 1995). Additionally, although high MU concentrations will indicate the relatively high protein:energy ratio, they do not necessarily indicate which of these two nutrients is in relative excess or deficiency (Oltner and Wiktorsson 1983). The latter study observed that MU concentrations remained moderate so long as levels of protein and energy were balanced relative to one another, whether or not they were both fed in excess, both underfed, or both fed at recommended levels (Oltner and Wiktorsson 1983). Clearly, variations in any or all of these nutrient composition variables could result in different levels of production among different studies, leading to contradictory findings as to the nature of the relationship between MU and production.
least squares means and standard errors of MU by SCS categories are given in Table 7 and Figure 3a. On contrast, least squares means and standard errors of SCC measures by MU categories are given in Table 10 and Figure 6a.
|
|
|
|
|
|
From these tables, it could be noticed that there are negative relationships between MU and SCC measures. SCC followed MU concentrations in an inverse order. Milk urea content, adjusted for the other factors, significantly decreases with increasing SCS. The first SCS category (0-3) had the highest MU (33.2 mg/dl) whereas; the last SCS category (7-9) had the lowest MU (30.6 mg/dl). On the other hand, SCC and SCS were 546,000 cell/ml and 4.10, respectively in test-day samples contain <15 mg/dl MU, meanwhile they were 307,000 cell/ml and 3.38, respectively in test-day samples contain > 55 mg/dl MU. Average SCC for MU 1-6 categories were 546, 445, 420, 348, 333 and 307 cell (×1000)/ml, respectively (Table 10). Little research has been published exploring the association between MU and SCC. Godden et al (2001), Rajala-Schultz and Saville (2003) and Hojman et al (2004 and 2005) found that the relationship of MU with SCC was strongly negative. Hojman et al (2004) considered the relationship between Mu and SCC as a puzzle, that those variables refer to physiological processes that are not clearly connected. Milk urea is related to protein and NPN supply and their utilization rate in the rumen; SCC reflects the degree of irritation in the udder. Godden et al (2001b) reported a negative association between cow-level MUN and linear score in 60 commercial Ontario Holstein herds over a 13-mo period, but no association between herd average linear score and herd average MUN. Stoop et al (2007) found a strong genetic correlation of milk urea with SCS (0.85). They added that the genetic correlation was surprising because the phenotypic correlation was weak (0.00). The phenotypic correlation was in line with other studies. Ng-Kwai-Hang et al (1985) demonstrated a slight increase in non-protein nitrogen with increasing SCC. They reported a small but significant positive association between SCC and milk NPN levels (which includes urea). Meanwhile, Eicher et al (1999) found insignificant effect of SCC on urea. Godden et al (2001) found significant negative nonlinear association between cow-level MU and linear score of SCC. Stoop et al (2007) stated that the high genetic correlation of milk urea with SCS (0.85), suggests that the same genetic mechanism is associated with SCS and MUN, e.g., possibly due to changes in protein metabolism during episodes of mastitis. DePeters and Ferguson (1992), in a review of previous studies, reported that milk from mastitic glands was lower in casein and higher in noncasein protein. They suggested that casein breakdown products contributed to the whey protein fraction of mastitic milk. Rajala-Schultz and Saville (2003) found that milk SCC (expressed as linear score) was negatively associated with MUN in the high production herds (P < 0.01) but no association in the low producing herds. They added that with a unit increase in linear score, MUN concentration decreased by 0.2 mg/ dl. Faust et al (1997) reported that MUN values were lowest for samples with largest SCC. These observations would agree with our finding that increasing SCC was associated with decreasing MUN. Arunvipas et al (2003) found that linear score had a strong negative relationship with MUN concentration. Godden et al (2000) made the comment that it is unknown how much of the negative association observed between MUN and somatic cells is attributable to the failure of the computer algorithm to control completely for the negative interfering effect of somatic cells when measuring urea in samples with very-high SCC.
Least squares means and standard errors of PP and PY by TDM categories are given in Table 8 and Figure 4a. On contrast, least squares means and standard errors of TDM by PP categories are given in Table 9 and Figure 5a. A negative linear relationship between milk yield and PP in the same milking was observed. TDM for PP less than 3.2% was 24.6 kg, meanwhile, it was 18.6 kg for PP >3.8. >From these Tables, it could be noticed that there is a significant negative relationship between PP and TDM.
Highly significant effects (P<0.001) on SCC, MU and milk production traits were found for MOR and DIM. Therefore, the effects of environmental variables must be taken into consideration when cows are evaluated and when developing and comparing models to be used in adjusting data to provide the best estimates of genetic parameters for selection purposes in the dairy cattle evaluation.
The results demonstrate the importance of surroundings and management practice. Therefore, management play a great role as source of variability and has a effective role in maintaining optimum SCC and MU levels for health status and nutrition.
Milk urea content varied by different environmental variables, so researchers should consider controlling for these variables as potential confounders when exploring the relationship between MU and nutritional management or measures of performance such as production or reproduction.
The results suggest that MU should be evaluated in association with month of the year, DIM, milk yield, and protein percentage when determining the efficiency of N utilization.
The author wishes to thank Pavel Bucek from the Czech Moravian Breeders´ Corporation, Inc., Hiradistko, Czech Republic for providing the data. Thanks also are extended to European Commission, Directorate-General for Education and Culture (Tempus Project) for financial support through the individual mobility grant (IMG) to Institute of Animal Science, Prague-Uhrinives, Prague, the Czech Republic (IMG_EG3044-2004). The author gratefully acknowledges Dr. Jarmila Bohmanova, Department of Animal and Poultry Science, University of Guelph, ON, Canada for revising the manuscript.
Arunvipas P, Dohoo I R, Van Leeuwen J A and Keefe G P 2003 The effect of non-nutritional factors on milk urea nitrogen levels in dairy cows in Prince Edward Island, Canada. Preventive Veterinary Medicine 59: 83–93 http://www.ncbi.nlm.nih.gov/pubmed/12719019
Arunvipas P, Van Leeuwen J A, Dohoo I R, Keefe G P 2004 Bulk tank milk urea nitrogen: Seasonal patterns and relationship to individual cow milk urea nitrogen values. The Canadian Journal of Veterinary Research, 68: 169–174 http://www.pubmedcentral.nih.gov/articlerender.fcgi?artid=1142135
Atakan K O Ç 2008 A Study of Somatic Cell Counts in the Milk of Holstein-Friesian Cows Managed in Mediterranean Climatic Conditions. Turkish Journal Veterinary Animal Science 32(1): 13-18 http://journals.tubitak.gov.tr/veterinary/issues/vet-08-32-1/vet-32-1-3-0602-30.pdf
Auldist M J, Coats S, Rogers G L and McDowell G H 1995 Changes in the composition of milk from healthy and mastitic dairy cows during the lactation cycle. Australian Journal of Experimental Agriculture 35: 427-436
Auldist M J and Hubble I B 1998 Effects of mastitis on raw milk and dairy products. The Australian Journal of Dairy Technology 53: 28-36
Baker L D, Ferguson J D and Chalupa W 1995 Reponses in urea and true protein to different feeding schemes for dairy cows. Journal of Dairy Science 78: 2424–2434 http://jds.fass.org/cgi/reprint/78/11/2424.pdf
Barker A R, Schrick F N, Lewis M J, Dowlen H H, Oliver S P 1998 Influence of clinical mastitis during early lactation on reproductive performance of Jersey cows. Journal of Dairy Science 81: 1285–1290 http://jds.fass.org/cgi/reprint/81/5/1285.pdf
Bodoh G W, Banista W J, Schultz L H and Johnson Jr R P 1976 Variation in somatic cell counts in Dairy Herd Improvement milk samples. Journal of Dairy Science 59: 1119-1123 http://jds.fass.org/cgi/reprint/59/6/1119.pdf
Broderick G A and Clayton M K 1997 A statistical evaluation of animal and nutritional factors influencing concentrations of milk urea nitrogen. Journal of Dairy Science 80: 2964–2970 http://jds.fass.org/cgi/reprint/80/11/2964.pdf
Bruckental J, Oldham D and Sutton J D 1980 Glucose and urea kinetics in cows in early lactation. British Journal of Nutrition, 44: 33-45 http://journals.cambridge.org/download.php?file=%2FBJN%2FBJN44_01%2FS0007114580000086a.pdf&code=29abd14a29beea6a9a01ec5fab104dcd
Butler W R, Calaman J J and Beam S W 1995 Plasma and milk urea nitrogen in relation to pregnancy rate in lactating dairy cattle. Journal of Animal Science 74: 858-865 http://jas.fass.org/cgi/reprint/74/4/858.pdf
Calberry J 2003 Milk urea nitrogen testing to improve protein utilization in dairy cattle. Factsheet, Ontario Ministry of Agriculture Food and Rural Affairs (OMAFRA) http://www.omafra.gov.on.ca/english/livestock/dairy/facts/03-117.htm
Calus M P L, Janss L L G and Veerkamp R F 2006 Genotype by Environment Interaction for Somatic Cell Score Across Bulk Milk Somatic Cell Count and Days in Milk. Journal of Dairy Science 89: 4846-4857 http://jds.fass.org/cgi/reprint/89/12/4846
Capuco A V and Akers R M 1999 Mammary involution in dairy animals. Journal of Mammary Gland Biology, Neoplasia 4: 137–144
Carlén E, Strandberg E and Roth A 2004 Genetic parameters for clinical mastitis, somatic cell score and production in the first three lactations of Swedish Holstein cows. Journal of Dairy Science 87: 3062–3070 http://jds.fass.org/cgi/reprint/87/9/3062.pdf
Carlsson J J, Bergstro m and Pehrson B 1995 Variations with breed, age, season, yield, stage of lactation and herd in the concentration of urea in bulk milk and individual cow’s milk. Acta Veterinaria Scandinavia 36: 245–254 http://www.ncbi.nlm.nih.gov/pubmed/7484551
Coffey E, Vinson E and Pearson E 1986 Potential of somatic cell concentration in milk as a sire selection criterion to reduce mastitis in dairy cattle. Journal of Dairy Science 69: 2163-2172 http://jds.fass.org/cgi/reprint/69/8/2163.pdf
Coulon J B, Dauver F, Garel J P 1996 Facteurs de variation de la umration cellulaire du lait chez des vaches laitires indemnes de mammites cliniques (Changes in somatic cell count in dairy cows free of clinical mastitis). INRA Prod. Anim. 9 (2): 133-139 http://granit.jouy.inra.fr/productions-animales/1996/Prod_Anim_1996_9_2_05.pdf
De Haas Y, Ouweltjes W, Napel J ten, Windig J J and De Jong G 2008 Alternative Somatic Cell Count Traits as Mastitis Indicators for Genetic Selection . Journal of Dairy Science 91: 2501-2511 http://jds.fass.org/cgi/reprint/91/6/2501.pdf
De Peters E J and Ferguson J D 1992 Nonprotein nitrogen and protein distribution in the milk of cows. Journal of Dairy Science 75: 3192– 3209 http://jds.fass.org/cgi/reprint/75/11/3192.pdf
Dodd F H and Booth J M 2000 Mastitis and milk production. In: Andrews A H (Editor), The Health of Dairy Cattle. Blackwell Science Ltd., Oxford, UK, pp. 213–255.
Dohoo I R 1993 An evaluation of the validity of individual cow somatic cell counts from cows in early lactation. Preventive Veterinary Medicine 16: 103-110
Dürr J W, Cue R I, Monardes H G, Moro-Méndez J and Wade K M 2008 Milk losses associated with somatic cell counts per breed, parity and stage of lactation in Canadian dairy cattle. Livestock Science 117: 225–232 http://library.wur.nl/WebQuery/cgn/lang/1883704
Eicher R, Bouchard E and Bigras-Poulin M 1999 Factors affecting milk urea nitrogen and protein concentrations in Quebec dairy cows. Preventive Veterinary Medicine 39: 53–63 http://www.ncbi.nlm.nih.gov/pubmed/10081788
Emanuelson U, Danell B and Philipsson J 1988 Genetic parameters for clinical mastitis, somatic cell counts and milk production estimated by multiple-trait restricted maximum likelihood. Journal of Dairy Science 71: 467-476 http://jds.fass.org/cgi/reprint/71/2/467.pdf
Emanuelsson U and Persson E 1984 Studies on somatic cell counts in milk from Swedish dairy cows. I. Nongenetic causes of variation in monthly test-day results. Acta Agricultura Scandinavia. 34: 33-44
Faust M A, Kilmer L H and Funk R 1997 Effects of laboratories for milk urea nitrogen and other milk components. Journal of Dairy Science 80 (Supplement 1): 249. (Abstract)
Ferguson J D 2002 Milk Urea Nitrogen. Center for Animal Health and Productivity. Pennsylvania University http://cahpwww.vet.upenn.edu/mun/mun_info.html
Ferguson J D, Thomsen N, Slesser D and Burris D 1997 Pennsylvania DHIA milk urea testing. Journal of Dairy Science 80 (Supplement 1):161 (Abstract)
Fetrow J, Mann D, Butcher K and McDaniel B 1991 Production losses from mastitis: Carry-over from the previous lactation. Journal of Dairy Science 74: 833–839 http://jds.fass.org/cgi/reprint/74/3/833.pdf
Garcia A D, Linn J G, Stewart S C, Olson J D and Olson W G 1997 Evaluation of milk urea nitrogen (MUN) as a dietary monitor for dairy cows. Journal of Dairy Science 80(Supplement 1): 161 (Abstract)
Godden S M, Lissemore K D, Kelton D F, Leslie K E, Walton J S and Lumsden J H 2000 Factors associated with milk urea concentrations in Ontario dairy cows. Journal of Dairy Science 83: 2672–2672 http://jds.fass.org/cgi/reprint/83/11/2672.pdf
Godden S M, Lissemore K D, Kelton D F, Lumsden J H, Leslie K E and Walton J S 2000a. Analytic validation of an infrared milk urea assay and effects of sample acquisition factors on milk urea results. Journal of Dairy Science 83: 435–442 http://jds.fass.org/cgi/reprint/83/3/435.pdf
Godden S M, Kelton D F, Lissemore K D, Walton J S, Leslie K E and Lumsden J H 2001: Milk urea testing as a tool to monitor reproductive performance in Ontario dairy herds. Journal of Dairy Science 84:1397-1406 http://jds.fass.org/cgi/reprint/84/6/1397.pdf
Godden S M, Lissemore K D, Kelton D F, Leslie K E, Walton J S and Lumsden J H 2001a: Factors associated with milk urea concentrations in Ontario dairy cows. Journal of Dairy Science 84:107–114 http://jds.fass.org/cgi/reprint/84/1/107.pdf
Godden S M, Lissemore K D, Kelton D F, Leslie K E, Walton J S and Lumsden J H 2001b Relationships between milk urea concentration and nutritional management, production and economic variables in Ontario dairy herd. Journal of Dairy Science 84: 1128–1139 http://jds.fass.org/cgi/reprint/84/5/1128.pdf
Gustafsson A H and Palmquist D L 1993 Diurnal variation of rumen ammonia, serum urea and milk urea in dairy cows at high and low yields. Journal of Dairy Science 76: 475-484 http://jds.fass.org/cgi/reprint/76/2/475.pdf
Haile-Mariam M, Goddard M E and Bowman P J 2001 Estimates of Genetic Parameters for Daily Somatic Cell Count of Australian Dairy Cattle. Journal of Dairy Science 84: 1255–1264 http://jds.fass.org/cgi/reprint/84/5/1255.pdf
Heuven H C M, Bovenhuis H and Politiek R D 1988 Inheritance of somatic cell count and its genetic relationship with milk yield in different parities. Livestock Production Science 18: 115–127.
Hojman D, Gips M and Ezra E 2005 Association Between Live Body Weight and Milk Urea Concentration in Holstein Cows. Journal of Dairy Science 88: 580–584 http://jds.fass.org/cgi/reprint/88/2/580.pdf
Hojman D, Kroll O, Adin G. Gips M. Tavori B and Ezra E 2004 Relationships between milk urea and production, nutrition and fertility traits in Israeli dairy herds. Journal of Dairy Science 87: 1001–1011 http://jds.fass.org/cgi/reprint/87/4/1001.pdf
Ikonen T, Morri S, Tyrisevä AM, Ruottinen O and Ojala M 2004 Genetic and phenotypic correlations between milk coagulation properties, milk production traits, somatic cell count, casein content and pH of milk. Journal of Dairy Science 87: 458–467 http://jds.fass.org/cgi/reprint/87/2/458.pdf
Johnson R G and Young A J 2003 The Association Between Milk Urea Nitrogen and DHI Production Variables in Western Commercial Dairy Herds. Journal of Dairy Science 86: 3008–3015 http://jds.fass.org/cgi/reprint/86/9/3008.pdf
Jonker J S, Kohn R A and High J 2002 Use of milk urea nitrogen to improve dairy cow diets. Journal of Dairy Science 85:939–946 http://jds.fass.org/cgi/reprint/85/4/939.pdf
Jones G M, Pearson R E, Clabaugh G A and Heald C W 1984 Relationships between somatic cell counts and milk production. Journal of Dairy Science 67:1823-1831 http://jds.fass.org/cgi/reprint/67/8/1823.pdf
Kennedy B W, Sethar M S, Tong A R, Moxley J E and Downey B R 1982 Environmental factors influencing test day somatic cell counts in Holsteins. Journal of Dairy Science 65: 275-280 http://jds.fass.org/cgi/reprint/65/2/275.pdf
Kiiman H and Kaart T 2004 On somatic cell count in milk. In: Proceedings of the 10th Animal Breeding in Baltics Conference. 13-14 May, Institute of Animal Science, Estonian Agricultural University, Tartu, Estonia, 2004. P: 36-39 http://www.eau.ee/~lki/babc/X/
Kohn R A, Dinneen M M and Russek-Cohen E 2005 Using blood urea nitrogen to predict nitrogen excretion and efficiency of nitrogen utilization in cattle, sheep, goats, horses, pigs and rats, Journal of Animal Science 83: 879-889 http://jas.fass.org/cgi/content/full/83/4/879
Kohn R A, Kalscheur K F and Russek-Cohen E 2002 Evaluation of Models to Estimate Urinary Nitrogen and Expected Milk Urea Nitrogen. Journal of Dairy Science 85: 227–233 http://jds.fass.org/cgi/reprint/85/1/227.pdf
Koivula M, Mantyssaari E A, Negussie E and Serenius T 2005 Genetic and phenotypic relationships among milk yield and somatic cell count before and after clinical mastitis. Journal of Dairy Science 88: 827–833 http://jds.fass.org/cgi/reprint/88/2/827.pdf
Kureoja A and Kaart T 2004 Genetic and environmental influences on urea concentration in dairy cows, milk. In: Proceedings of the 10th Animal Breeding in Baltics Conference. 13-14 May, Institute of Animal Science, Estonian Agricultural University, Tartu, Estonia, 2004. P: 42-47 http://www.eau.ee/~lki/babc/X/
Macleod G K, Grieve D G, McMillan I and Smith G C 1984 Effect of varying protein and energy densities in complete rations. Journal of Dairy Science 67: 1421–1429 http://jds.fass.org/cgi/reprint/67/7/1421.pdf
Miglior F, Sewalem A, Jamrozik J, Lefebvre D M and Moore R K 2006 Analysis of Milk Urea Nitrogen and Lactose and Their Effect on Longevity in Canadian Dairy Cattle. Journal of Dairy Science 89: 4886-4894 http://jds.fass.org/cgi/reprint/89/12/4886.pdf
Miller R H, Emanuelson U, Persson E, Brolund L, Philipsson J and Funke H 1983 Relationships of milk somatic cell counts to daily milk yield and composition. Acta Agriculture Scandinavia 33: 209-223
Miller R H, Norman H D, Wiggans G R and Wright J R, 2004 Relationship of test day somatic cell score with test day and lactation milk yields. Journal of Dairy Science 87: 2299–2306 http://jds.fass.org/cgi/reprint/87/7/2299.pdf
Moller S, Matthew C and Wilson G F 1993 Pasture protein and soluble carbohydrate levels in spring dairy pasture and associations with cow performance. Proceedings of the New Zealand Society of Animal Production 54: 83–86
Mostert B E, Banga C, Groeneveld E and Kanfer F H J 2004 Breeding value estimation for somatic cell score in South African dairy cattle. South African Journal of Animal Science 34 (Supplement 2): 32-34
Nelson A J 1996 Practical application of MUN analysis. The AABP Bovine Proceedings 29: 85-95
Ng-Kwai-Hang K F, Hayes J F, Moxely J E and Monardes H G 1985 Percentages of protein and nonprotein nitrogen with varying fat and somatic cells in bovine milk. Journal of Dairy Science 68:1257–1262 http://jds.fass.org/cgi/reprint/68/5/1257.pdf
Norman H D, Miller R H, Wright R and Wiggans G R 2000 Herd and state means for somatic cell count from dairy herd improvement. Journal of Dairy Science 83: 2782-2788 http://jds.fass.org/cgi/reprint/83/12/2782.pdf
Oldham J D 1984 Protein-energy interrelationships in dairy cows. Journal of Dairy Science 67:1090–1114 http://jds.fass.org/cgi/reprint/67/5/1090.pdf
Oltner R, Emanuelson M and Wiktorsson H 1985 Urea concentration in cows milk in relation to milk yield, live weight, lactation number and composition of feed given. Livestock Production Science 12: 45–57
Oltner R and Wiktorsson H 1983 Urea concentrations in milk and blood as influenced by feeding varying amounts of protein and energy to dairy cows. Livestock Production Science 10: 457–467
Oudah E Z M 2008 Phenotypic relationships among somatic cell count, milk urea content, test-day milk yield and protein percent in dairy cattle. Volume 20, Article #132. Retrieved August 21, 2008 http://www.lrrd.org/lrrd20/8/ouda20132.htm
Philipsson J, Ral G and Berglund B 1995 Somatic cell count as a selection criterion for mastitis resistance in dairy cattle. Livestock Production Sci. 41: 195-200
Pryce J E, Esslemont R J, Thompson R, Veerkamp R F, Kossaibati M A and Simm G 1998 Estimation of genetic parameters using health, fertility and production data from a management recording system for dairy cattle. Animal Science 66: 577–584
Rajala-Schultz P J and Saville W J A 2003 Sources of Variation in Milk Urea Nitrogen in Ohio Dairy Herds. Journal of Dairy Science 86: 1653–1661 http://jds.fass.org/cgi/reprint/86/5/1653
Raubertas R F and Shook G E 1982 Relationship between lactation measures of somatic cell concentration and milk yield. Journal of Dairy Science 65: 419-425 http://jds.fass.org/cgi/reprint/65/3/419.pdf
Reents R, Jamrozik J, Schaeffer L R and Dekkers J C M 1995 Estimation of genetic parameters for test day records of somatic cell score. Journal of Dairy Science 78: 2847–2857 http://jds.fass.org/cgi/reprint/78/12/2847.pdf
Rekik B, Ajili N, Belhani H, Ben Gara A and Rouissi H 2008 Effect of somatic cell count on milk and protein yields and female fertility in Tunisian Holstein dairy cows. Livestock Production Science 116: 309–317
Rodriguez-Zas Sandra L, Gianola D and Shook G E 2000 Evaluation of models for somatic cell score lactation patterns in Holsteins. Livestock Production Science 67: 19–30
Ruegg P L, Pantoja J and Hulland C 2008 Intramammary Infections and Somatic Cell Counts across the Dry Period. Presented at XII Curso Novos Enfoques Na Producaoe reproducao de Bovinos, Uberlandia Brazil, March 6-8, 2008 http://www.uwex.edu/milkquality/PDF/Ruegg%20IMI%20and%20SCC%20dry%20period%20Brazil%202008.pdf
Sargeant J M, Schukken Y H and Leslie K E 1998 Ontario bulk milk somatic cell count reduction program: progress and outlook. Journal of Dairy Science Vol. 81. p. 1545-1554 from http://jds.fass.org/cgi/reprint/81/6/1545.pdf
SAS 2004 SAS Institute, Inc. 2004. User’s guide. Version 9.0. SAS Institute, Inc., Cary, NC, USA
Schaeffer L R, Jamrozik J, Kistemaker G J and Van Doormaal B J 2000 Experience with a Test – Day Model. Journal of Dairy Science 83: 1135-1144 http://jds.fass.org/cgi/reprint/83/5/1135.pdf
Schepers A J and Meijer R G M 1998 Evaluation of the Utilization of Dietary Nitrogen by Dairy Cows Based on Urea Concentration in Milk. Journal of Dairy Science 81: 579-584 http://jds.fass.org/cgi/reprint/81/2/579.pdf
Sheldrake R F, McGregor G D and Hoare R J T 1983 Somatic Cell Count, Electrical Conductivity and Serum Albumin Concentration for Detecting Bovine Mastitis. Journal of Dairy Science 66: 548-555 http://jds.fass.org/cgi/reprint/66/3/548.pdf
Shook G E 1982 A linear scale for scoring somatic cell count. Journal of Dairy Science 65: supplement l): 108 (Abstract)
Shuster D E, Harmon R J, Jackson J A and Hemken R W 1991 Suppression of Milk Production During Endotoxin-Induced Mastitis. Journal of Dairy Science, 74(11): 3763-3774 http://jds.fass.org/cgi/reprint/74/11/3763.pdf
Stoop W M, Bovenhuis H and Arendonk J A M van 2007 Genetic Parameters for Milk Urea Nitrogen in Relation to Milk Production Traits. Journal of Dairy Science 90: 1981–1986 http://jds.fass.org/cgi/reprint/90/4/1981.pdf
Spicer L J, Francisco CC, Jones D and Waldner D N 2000 Changes in Milk Urea Nitrogen During Early Lactation in Holstein Cows. Animal Science Research Report Pages, Oklahoma Agricultural Experiment Station, Oklahoma State University, pp. 169-171 http://www.ansi.okstate.edu/research/2000rr/31.htm
Vandehaar M J 1998 Efficiency of nutrient use and relationship to profitability on dairy farms. Journal of Dairy Science 81:272–282 http://jds.fass.org/cgi/reprint/81/1/272.pdf
Van Schaik G, Lotem M and Schukken Y H 2002 Trends in somatic cell Counts, bacterial counts and antibiotic residue violations in New York State during 1999-2000. Journal of Dairy Science 85: 782-789 http://jds.fass.org/cgi/reprint/85/4/782.pdf
Van Soest P J 1994 Nutritional Ecology of the Ruminant. Cornell University Press. Ithaca, New York
Wattiaux M A, Nordheim E V and Crump P 2005 Statistical Evaluation of Factors and Interactions Affecting Dairy Herd Improvement Milk Urea Nitrogen in Commercial Midwest Dairy Herds. Journal of Dairy Science 88: 3020-3035 http://jds.fass.org/cgi/reprint/88/8/3020.pdf
Weller J, Sran A and ZeligeY 1992 Genetic and environmental relationships among somatic cell count, bacterial infection and clinical mastitis. Journal of Dairy Science 75: 2532-2540. from http://jds.fass.org/cgi/reprint/75/9/2532.pdf
Wicks H C F and Leaver J D 2006 Influence of genetic merit and environment on somatic cell counts of Holstein–Friesian cows. The Veterinary Journal 172: 52–57 http://www.ncbi.nlm.nih.gov/pubmed/16772131?dopt=Abstract
Wiggans G R 1986 Projection of protein yield to 305 days. Journal of Dairy Science 69: 2908-2914 http://jds.fass.org/cgi/reprint/69/11/2908.pdf
Wiggans G R and Shook G E 1987 A lactation measure of somatic cell count. Journal of Dairy Science 70: 2666-2672 http://jds.fass.org/cgi/reprint/70/12/2666.pdf
Wood P D P 1976 Algebraic models of the lactation curve for milk, fat and protein production with estimates of seasonal variation. Animal Production 22: 35-40
Wood G M, Boettcher P J, Jamrozik J, Jansen G B and Kelton D F 2003 Estimation of Genetic Parameters for Concentrations of Milk Urea Nitrogen. Journal of Dairy Science 86: 2462-2469 http://jds.fass.org/cgi/reprint/86/7/2462.pdf
Received 31 December 2008; Accepted 15 February 2009; Published 1 May 2009