 |
| Photo 1: Pig corral with raised floor |
| Livestock Research for Rural Development 26 (3) 2014 | Guide for preparation of papers | LRRD Newsletter | Citation of this paper |
Pig production has increasingly become an important activity, especially among smallholder farmers in Uganda in the past three decades as evidenced by a dramatic rise in pig population from 0.19 to 3.2 million. This is linked to the rise in demand for pork due to changes in preferences. Per capita consumption of pork has been estimated at 3.4 kg/person/year representing a ten-fold increase in the last 30 years. Pigs are important assets for the poor smallholders in Uganda generating income for meeting planned and emergency household financial needs. Despite its importance, the smallholder pig systems are faced with a number of productivity and market related constraints ranging from diseases, poor nutrition and poorly organized markets. Strong growth opportunities to improve smallholder pig systems exist if the constraints are minimized. However the constraints and opportunities vary among smallholder producers as they are not a homogenous group and are affected by various factors.
This paper applies a cluster analysis to characterize smallholder pig production systems into typologies in three districts in Uganda by utilizing village level data from 35 villages. The paper further explores the constraints and opportunities for the different typologies to engage with output and input market systems. The paper concludes that different interventions are necessary to improve market linkages with the smallholder pig production systems due to their varying differences in terms of farmers’ cooperative involvement, institutional linkages and intensification related indicators.
Keywords: cluster analysis, cooperative involvement, institutions, intensification, typologies
Pig production has increasingly become an important activity in Uganda with pig population rising in the last three decades from 0.19 million to 3.2 million pigs (Uganda Bureau of Statistics 2009 and FAOSTAT 2011). Uganda has the highest per capita consumption of pork in sub-Saharan Africa with a 2011 estimate of 3.4 kg/person/year representing a ten-fold increase in the last 30 years. More than 1.1 million families in Uganda own pigs (Uganda Bureau of Statistics 2009). The pig enterprise is mostly managed by women and children as a backyard activity in smallholder households in peri-urban and rural areas. The majority of pigs are kept by smallholder households under extensive systems with small numbers of peri-urban small scale, semi-intensive farms and a few large modern intensive farms producing for commercial purposes (Tatwangire 2013). Households rear pigs because they grow fast, there is a ready market and proven demand and are highly prolific which can result in quick generation of cash (Mutua et al 2010). Pigs therefore play an important role in risk diversification and livelihood security of smallholder and poor households as they are important assets useful in generating income for school fees payment, purchase of farm inputs and covering emergency cash needs while the manure is used in fertilization of the crop fields.
In smallholder systems pigs are mainly fed on kitchen food wastes, crop residues, especially sweet potato vines, cassava leaves and peelings, banana peelings and by-products of crops such as maize and cocoyam (Katongole et al 2012). Most of the smallholder pig farmers invest minimal financial capital in the enterprise with the majority in rural settings practicing free range system or tethering with little or no housing (Waiswa 2005). The sector is largely informal with poorly organized markets, limited access to technology, information and services. Most of the pigs are sold directly to butchers or through middlemen for slaughter in local informal systems. Other constraints associated with the sector include instability of feed supply over the year, lack of feed quality control measures and disease risks such as African swine fever that wipes out pig herds during periods of outbreak or parasites that are endemic and lead to stunted growth which causes reduce market value.
Strong growth opportunities to improve smallholder pig systems, adapted to the environment, production objectives and market opportunities exist if the constraints are minimized. However, smallholder pig systems are not a homogenous group, nor are the constraints associated with the system. There is therefore a need for identification of the existing smallholder pig production system typologies and their associated constraints for better targeting of technological and institutional innovations to address system constraints.
The objective of the study is to identify the existing smallholder pig production systems typologies in three districts in Uganda. It further explores the institutional and market related constraints and opportunities for the different typologies.
The data used in the analysis of smallholder pig production system typologies is derived from a recent survey of pig farmers in 35 villages of Masaka, Mukono and Kamuli districts in Uganda. The three districts were selected based on geographical targeting through Geographic Information Systems (GIS) characterization and stakeholder consultation. Data overlays of pig population density, poverty levels and market access were used in the GIS characterization process to depict differences in the districts and variations in the pig value chain types (Van de Steeg 2013).
The pig value chain types were broadly classified into domains based on location of production and consumption. These included; rural-rural value chain domains defined as rural production areas for rural consumption, rural-urban value chains described as rural production areas targeting urban consumption and urban-urban value chains referring to peri-urban production areas for urban consumption. Data on pig population density was derived from the 2008 livestock census while the poverty levels, based on head count ratios were derived from the human population census data, gridded population maps and the national poverty lines (ibid.). Time taken to reach the nearest urban center was used to proxy market access and served an important role in classifying the districts into different value chain types. The results from the GIS process identified 10 potential districts with high pig population density and poverty levels. The next step involved stakeholder consultations through a site selection workshop to validate the GIS characterisation results and to identify other criteria that were not covered in the spatial analysis. The 10 potential districts were then scored against both the GIS characterisation and identified criteria by stakeholders. The top three districts, Masaka, Mukono and Kamuli were selected for the pig value chain activities.
Further location identification within the selected districts was done by using the pig population census data at sub-county level and administration of a minimum checklist to different stakeholders for further scrutiny of the existing value chain types. For each district, 2 sub-counties were selected to represent each value chain domain type. Within each selected sub-county 2-3 villages were randomly selected for the pig value chain activities, yielding a total of 35 villages (Table 1).
|
Table 1: Selected sub-counties and value chain domains |
||||
|
District |
County |
Sub-county |
Dominant value chain domain |
Number of villages sampled |
|
Masaka |
Bukoto |
Kkingo |
Rural–rural |
3 |
|
Bukoto |
Kyanamukaka |
Rural-rural |
3 |
|
|
Bukoto |
Kabonera |
Rural-urban |
3 |
|
|
Masaka Municipality |
Kimanya-Kyabakuza |
Urban-urban |
2 |
|
|
Masaka Municipality |
Katwe-Butego |
Urban-urban |
2 |
|
|
Masaka Municipality |
Nyendo-Ssenyange |
Urban-urban |
2 |
|
|
Bugabula |
Kitayunjwa |
Rural-rural |
2 |
|
|
Kamuli |
Bugabula |
Namwendwa |
Rural-rural |
2 |
|
Buzaaya |
Bugulumbya |
Rural-rural |
4 |
|
|
Mukono |
Mukono town council |
Urban-urban |
2 |
|
|
Mukono |
Goma |
Urban–urban |
2 |
|
|
Mukono |
Mukono |
Kyampisi |
Rural-urban |
4 |
|
Mukono |
Ntenjeru |
Rural-rural |
4 |
|
Data was collected through farmer focus group discussions using participatory rural appraisal (PRA) techniques based on semi-qualitative checklists. In each village one focus group discussion was held with farmers, yielding a total of 35 group discussions. The farmer survey was conducted from November 2012 to February 2013 by local facilitators who were trained on the participatory tools prior to the exercise. The semi-qualitative checklists used to collect the data were developed through working group consultations with scientists from different disciplinary domains from three Consultative Group on International Agricultural Research (CGIAR) centers involved in the Livestock and Fish CGIAR Research Program. The checklist covered various subject domains in order to gain an understanding on the existing smallholder pig systems and the associated constraints and opportunities. The checklist coverage included pig health, feeding, breeds and breeding management, and pig value chain mapping.
In order to select farmers to participate in the famer focus group discussions, pig farmers lists for each village were obtained from village administrative authorities, mainly the local council officials and local government staff working in the areas. A stratified random sample of 40 pig farmers, based on gender, was then drawn for each village from the lists provided. The randomly sampled farmers were then invited for the farmer focus group discussions. A total of about 1400 farmers from the 3 districts participated in the focus group discussions. The farmer focus group discussions involved mixed men-women groups for some sessions while others were separate women and men only groups.
Cluster analysis was employed in this study to identify different smallholder pig farmer typologies. Cluster analysis allows identification of different groups, characterized by maximal within-group homogeneity and between-group heterogeneity. We used the methodology advocated by Punj and Steward (1983) for marketing research, applied by Petrovici and Gorton (2005) and by Jansen (2006) for quantitative livelihood research. In the first step, Ward’s hierarchical clustering method, based on squared Euclidean distances, was used. This agglomerative method works stepwise to combine pairs of individual observations or clusters while minimizing the within cluster variance (Aldenderfer and Balshfield 1984). The dendrogram derived from this algorithm allows for visual inspection to determine the optimal number of clusters.
For our analysis, a three cluster solution provided the optimal balance between parsimony and homogeneity. In a second step, the data were clustered through a K-means iterative partitioning analysis. While hierarchical clustering methods have the disadvantage of building upon previous steps without the possibility to revise previous decisions, the K-means algorithm reassigns cases to clusters through an iterative procedure. It allocates data points to the cluster with the nearest centroid, then computes the new cluster centroids, and alternates these steps until no data points change cluster. The statistical criterion it uses is to minimize the sum of the squared Euclidean distances between individuals and their group mean. The number of clusters and the initial cluster centroids are derived from Ward’s (hierarchical) algorithm of step 1 (Aldenderfer and Balshfield 1984 and Everitt 2001).
The three-cluster solution using SPSS software is presented in Table 4. The groups of variables used in the cluster analysis were selected apriori on the basis of “themes” considered centrally important to the heterogeneity of the smallholder production systems from previous studies such as Staal et al (2001). These themes include farmers’ cooperative involvement assessed through membership to producer groups, institutional linkages gauged by the number of institutions involved in livestock value chains within the villages and some intensification related indicators such as breed type, housing, and husbandry practices.
Table 2 contains summary statistics of the variables used in the cluster analysis. On average, 40% of the smallholders participated in cooperative action through membership to farmer groups though a much lower proportion, 7-12% belonged to pig producer groups, implying that possibly such groups may be non-existent in the study sites. Tethering seemed to be a common practice among the smallholder pig farmers, though a small proportion of farmers, about 30% had pig pigsties. Common pig husbandry practices by the smallholder pig producers included castration and deworming but few producers gave iron injection.
Dummy variables for the value chain types were also included to capture any difference associated with location, though rural-rural type was prevalent. Information was also collected on the different types of pig producers; those who specialize in piglet production and sale of weaners (piglet producers), the ones carrying out fattening and sale of grown pigs for slaughter (growers) and those doing both. Smallholder piglet producers owned an average of 2 sows including replacement females, while the growers had an average of 2-3 grown pigs. There was a large variation in land size, depending on the location. In the peri-urban areas of Masaka and Mukono districts, land sizes were small with a typical smallholder utilizing an average of 0.11 acres compared to about 4 acres in the rural-rural value chain of Kamuli district.
|
Table 2: Summary statistics of variables used in cluster analysis |
|
|
Variable |
% of farmers |
|
Cooperative action and institutions |
|
|
Male farmers belonging to farmer groups |
41.6 |
|
Female farmers belonging to farmer groups |
40.2 |
|
Male farmers belonging to pig producer group |
7.1 |
|
Female farmers belonging to pig producer group |
12.3 |
|
Average number of institutions involved in livestock value chains |
2.09 (0.19)** |
|
Production system parameters |
|
|
Farmers rearing improved pig breeds |
59.7 |
|
Farmers rearing local pig breeds |
40.3 |
|
Farmers having corrals for pig confinement |
33.4 |
|
Farmers practicing pig tethering |
43.5 |
|
Farmers practicing free-ranging (scavenging) |
12.9 |
|
Farmers producing piglets for sale (piglet producers) |
24.1 |
|
Farmers producing pigs for slaughter (growers) |
35.8 |
|
Farmers who are both piglet producers and growers |
40.1 |
|
Average land size (acres) |
1.48 (0.27)** |
|
Husbandry practices |
|
|
Farmers castrating their male pigs |
78.7 |
|
Farmers deworming the pigs |
93.5 |
|
Farmers giving iron injection |
9.5 |
|
Farmers servicing the sows |
54.4 |
|
Value chain type |
|
|
Households in Rural-rural domain |
51.4 |
|
Households in Rural-urban domain |
20.0 |
|
Households in Urban-urban domain |
28.6 |
|
** Mean calculations and standard error of means (SEM) in brackets |
|
In the rural-rural value chains most of the farmers did not house their pigs. Instead, the pigs were mainly tethered and in some cases left free to scavenge for food (Table 3). Free ranging or scavenging in the rural-rural value chains occurs during the day and the animals are confined in a house or tethered at night.
|
Table 3: Pig confinement status and types |
|||
|
Status |
Rural – rural |
Rural-urban |
Urban-urban |
|
|
% of households |
||
|
Tethering |
66 |
40 |
13 |
|
Free range/scavenging |
17 |
18 |
1 |
|
Housed: Raised floor |
5 |
6 |
25 |
|
Housed: un-raised floor |
16 |
37 |
61 |
Housing of pigs was common the urban-urban value chains. The types of housing varied in terms of levels of investment and whether the floor was raised or un-raised.
|
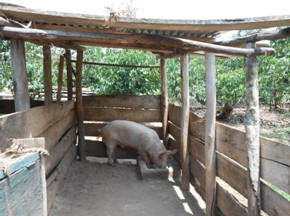
| Photo 1: Pig corral with raised floor |
The raised floor housing (photo 1) is characterised by an elevated floor, not in contact with the earth. In most cases it is made of timber with adequate spacing. The floor elevated houses are considered very hygienic because urine is eliminated easily, thereby making pigs clean. However, according to farmers, growth is slower when pigs are housed in raised floors due to stress associated with living under the elevated corrals. The non-elevated floor pig houses could be cemented or made of concrete or earth (Photo 2). The manure is easily collected and the floor can be easily cleaned.
 |
| Photo 2: Pig corral with non-raised cemented floor |
In the case when the floor is not cemented pigs can be very dirty because of direct contact with the soil (Photo 3).
 |
| Photo 3: Pig corral with earth floor |
The levels of financial investment in housing vary depending on the type of material used. Most farmers who are able to afford expensive housing for their pigs are medium to large scale holders, at least owning more than 5 pigs and having a higher financial capacity. Most smallholder farmers have corrals as typified in photos 1 and 3.
Pig farmers were mainly categorised into 3, depending on their production types. Piglet producers are those involved in piglet sales only while growers are those that buy or rear piglets, fatten and sell grown pigs for slaughter. In general there were high proportions of growers only and both piglet producers and growers compared to those specialising in piglet production only (Figure 1). However, in some sites such as Katwe – Butego the proportions of piglet producers only were significantly higher than the growers.
 |
| Figure 1: Pig production types, by sub-counties and value chain domains |
In the analysis of the primary market outlets of the grown pigs produced by the households, the results show that most of the households sold their pigs to butchers. Most of the households indicated that they had no alternative sales outlets apart from the butcheries. Sales to itinerant traders and directly to consumers comprised 20% and 5% by the producers, respectively (Figure 2). The average producer price by the butchers was Uganda Shilling 5200 per kilo while the traders offered Uganda Shilling 6000.
 |
| Figure 2: Primary market outlets for grown pigs: % of households |
The cluster analysis results show some major differences between the means of various clusters for some variables in the analysis (Table 4). The differences between the clusters are linked to variables associated with farmers’ cooperative involvement, institutional linkages and some of the intensification related indicators such as breed type of the pigs and confinement status. Clusters 1 and 2 largely comprised of villages in the rural-rural value chain domain while cluster 3 was dominated by villages in the urban-urban domain.
|
Table 4: Cluster analysis solution |
||||||
|
Variables |
Cluster 1 |
Cluster 2 |
Cluster 3 |
|||
|
N |
8 (23%) |
21(60%) |
6(17%) |
|||
|
|
Mean |
S.D. |
Mean |
S.D. |
Mean |
S.D. |
|
% male farmer group membership |
29.1 |
24.2 |
43.4 |
39.7 |
46.3 |
31.4 |
|
% female farmer group membership |
9.72 |
15.3 |
39.6 |
31.6 |
64.8 |
23.6 |
|
% male pig group membership |
0 |
0 |
0 |
0 |
31.3 |
45.8 |
|
% female pig group membership |
0 |
0 |
3.8 |
8.8 |
43.8 |
47.9 |
|
No. of institutions involved in livestock value chains |
2.0 |
0.9 |
1.7 |
1.1 |
3.1 |
0.8 |
|
% improved breeds |
50.0 |
16.1 |
57.8 |
23.2 |
72.1 |
19.1 |
|
% local breeds |
50.0 |
16.1 |
42.2 |
23.2 |
27.9 |
19.1 |
|
% both growers and piglet producers |
45.3 |
25.5 |
50.4 |
28.6 |
18.3 |
21.3 |
|
% piglet producers |
35.5 |
27.6 |
21.0 |
21.8 |
27.9 |
14.3 |
|
% farmers selling grown pigs (growers) |
42.5 |
33.0 |
32.0 |
26.1 |
41.9 |
38.5 |
|
% with pigsties |
9.3 |
6.0 |
26.9 |
14.7 |
68.4 |
42.4 |
|
% free range |
19.7 |
24.8 |
13.9 |
18.9 |
5.3 |
7.5 |
|
% tethered |
81.2 |
11.9 |
41.0 |
27.6 |
21.6 |
27.0 |
|
% castration |
86.2 |
21.5 |
72.5 |
25.4 |
89.4 |
13.5 |
|
% deworming |
95.0 |
8.4 |
91.9 |
22.3 |
96.4 |
10.4 |
|
% iron injection |
1.7 |
4.1 |
7.1 |
17.0 |
21.9 |
34.6 |
|
% servicing the sows |
0.0 |
0.0 |
90.7 |
13.2 |
0.0 |
0.0 |
|
Value chain domains (% of villages) |
|
|
|
|
|
|
|
Rural-rural |
66.7 |
|
57.1 |
|
25 |
|
|
Rural-urban |
33.3 |
|
19.0 |
|
12.5 |
|
|
Urban-urban |
0 |
|
23.8 |
|
62.5 |
|
The cluster solution differences were further explored through analysis of variance (ANOVA) for the different variables to assess the statistical significance of the mean differences (Table 5). For the sake of brevity, only variables that were statistically significant from 10% level are included in the ANOVA table. The between groups means are significant for eight of the variables, indicating that these variables reliably distinguish between the three clusters.
|
Table 5: Results from the analysis of variance (ANOVA) |
||||||
|
Variable |
|
Sum of Squares |
Degrees of freedom |
Mean Square |
F-value
|
Significance |
|
% of women who are members of farmer groups |
Between Groups |
10434 |
2 |
5217 |
6.674 |
0.004 |
|
Within Groups |
25015 |
32 |
782 |
|
|
|
|
Total |
35449 |
34 |
|
|
|
|
|
% of men who are members of farmer groups |
Between Groups |
6027 |
2 |
3013 |
6.565 |
0.004 |
|
Within Groups |
14688 |
32 |
459 |
|
|
|
|
Total |
20714 |
34 |
|
|
|
|
|
% of women who are members of pig farmer groups |
Between Groups |
10318 |
2 |
5159 |
9.362 |
0.001 |
|
Within Groups |
17635 |
32 |
551 |
|
|
|
|
Total |
27953 |
34 |
|
|
|
|
|
No. of institutions involved in livestock value chains |
Between Groups |
11.582 |
2 |
5.791 |
5.588 |
0.008 |
|
Within Groups |
33.161 |
32 |
1.036 |
|
|
|
|
Total |
44.743 |
34 |
|
|
|
|
|
% of farmers who are both piglet producers and growers |
Between Groups |
6055 |
2 |
3027 |
4.249 |
0.023 |
|
Within Groups |
22799 |
32 |
712 |
|
|
|
|
Total |
28854 |
34 |
|
|
|
|
|
% of farmers who confine pigs in pigsties |
Between Groups |
14149 |
2 |
7075 |
13.252 |
0.000 |
|
Within Groups |
17083 |
32 |
534 |
|
|
|
|
Total |
31232 |
34 |
|
|
|
|
|
% of farmers mainly practicing tethering |
Between Groups |
12469 |
2 |
6235 |
9.493 |
0.001 |
|
Within Groups |
21016 |
32 |
657 |
|
|
|
|
Total |
33485 |
34 |
|
|
|
|
|
% of farmers servicing their sows |
Between Groups |
69052 |
2 |
34526 |
318.517 |
0.000 |
|
Within Groups |
3469 |
32 |
108 |
|
|
|
|
Total |
72520 |
34 |
|
|
|
|
In order to determine where the cluster differences lie, a Tukey post-hoc test was conducted and the results presented in Table 6 (Gore 2000).
|
Table 6: Tukey post hoc test results |
|||||
|
Dependent Variable |
(I) Cluster |
(J) Cluster |
Mean Difference (I-J) |
Standard Error |
Significance |
|
% of women who are members of farmer groups |
1 |
2 |
-29.896 |
12.942 |
0.069 |
|
3 |
-55.109 |
15.099 |
0.003 |
||
|
2 |
1 |
29.896 |
12.943 |
0.069 |
|
|
3 |
-25.213 |
11.616 |
0.092 |
||
|
% of men who are members of farmer groups |
1 |
2 |
0.000 |
9.917 |
1.000 |
|
3 |
-31.250 |
11.570 |
0.029 |
||
|
2 |
1 |
0.000 |
9.917 |
1.000 |
|
|
3 |
-31.250 |
8.901 |
0.004 |
||
|
% of women who are members of pig farmer groups |
1 |
2 |
-3.855 |
10.867 |
0.933 |
|
3 |
-43.750 |
12.678 |
0.004 |
||
|
2 |
1 |
3.855 |
10.867 |
0.933 |
|
|
3 |
-39.895 |
9.753 |
0.001 |
||
|
No. of institutions involved in the livestock value chains |
1 |
2 |
0.286 |
0.471 |
0.818 |
|
3 |
-1.125 |
0.550 |
0.118 |
||
|
2 |
1 |
-0.286 |
0.471 |
0.818 |
|
|
3 |
-1.411 |
0.423 |
0.006 |
||
|
% of farmers who are both piglet producers and growers |
1 |
2 |
-5.136 |
12.356 |
0.909 |
|
3 |
27.007 |
14.415 |
0.163 |
||
|
2 |
1 |
5.136 |
12.356 |
0.909 |
|
|
3 |
32.143 |
11.089 |
0.018 |
||
|
% of farmers who confine pigs in pigsties |
1 |
2 |
-17.563 |
10.696 |
0.243 |
|
3 |
-59.041 |
12.478 |
0.000 |
||
|
2 |
1 |
17.563 |
10.696 |
0.243 |
|
|
3 |
-41.478 |
9.599 |
0.000 |
||
|
% of farmers practising tethering |
1 |
2 |
40.142 |
11.863 |
0.005 |
|
3 |
59.542 |
13.840 |
0.000 |
||
|
2 |
1 |
-40.143 |
11.863 |
0.005 |
|
|
3 |
19.398 |
10.647 |
0.179 |
||
|
% of farmers servicing their sows |
1 |
2 |
-90.667 |
4.820 |
0.000 |
|
3 |
0.000 |
5.623 |
1.000 |
||
|
2 |
1 |
90.667 |
4.820 |
0.000 |
|
|
3 |
90.667 |
4.326 |
0.000 |
||
The results reveal that female farmer group membership differed significantly between clusters 1 and 3 while male farmer group membership differed between clusters 2 and 3. In cluster 3, 65% of women belonged to farmer groups compared to only 10% in cluster 1. Similarly, women membership to pig farmer groups differed between clusters 1 and 3 and 1 and 2. In cluster 3, 44% of women belonged to pig producer groups compared to 4% in cluster 2. The proportion of pig farmers who are both piglet producers and growers differed between cluster 2 and 3, with a higher proportion, 50% in cluster 2 compared to 18% in cluster 3. The proportion of households practicing intensive production systems through pig confinement in corrals differed between cluster 1 and 3 and 2 and 3. A higher proportion of households, 68% in cluster 3 confined their pigs in sties compared to 27% and 9% in clusters 2 and 1, respectively. Most of the households in clusters 1 and 2 tethered their pigs.
The three clusters can thereby be defined based on their characteristics. Cluster 1 can be classified as “rural extensive and cooperative-poor producers” and largely comprise of villages in the rural-rural value chain types of Kamuli and Masaka district. It accounts for 23% of the surveyed villages. This cluster is characterized by low levels of involvement in cooperative action through farmer group membership. Similar to cluster 2 a few institutions, an average of 2, support livestock value chain activities through advisory services or provision of inputs, including piglets. These include institutions such as Volunteer Efforts for Development Concerns (VEDCO) and World Vision, both NGOs in Kamuli and Masaka districts respectively. In general, there are low investments in the pig enterprise for this cluster in terms of husbandry practices and housing, since most of the pig producers, 81% tether the animals compared to only 9 % that have pigsties. Those with pigsties are largely due to initiatives by the NGOs operating in the areas. There is however, no significant difference in terms of pig breed types kept by households in clusters 1 and 2.
Cluster 2, which is the predominant cluster, with 60% of the villages can be classified as “rural mixed intensive and extensive producers”. It comprises all value chain types, 57% of rural-rural, 19% of rural-urban and 24% of urban-urban domains of the 3 districts. The cluster is characterized by a relatively high involvement of cooperative action through farmer group memberships although pig producer groups seem non-existent as evidenced by the low proportion of households, 0-4% belonging to such groups. Compared to cluster 1, a relatively high proportion of pig farmers have pigsties though the majority still practices tethering. An outstanding characteristic in this cluster in terms of the pig husbandry practices is the high proportion of pig farmers, 91% servicing their sows when on heat. This may indicate ease of access to breeding services through communal village boars, the most common practice in the smallholder pig systems where the breeding service payment is paid in the form of 1 piglet or cash equivalent.
Cluster 3 can be classified as “peri-urban intensive associational type producers” and mainly comprise of villages in the urban-urban value chain of Masaka district, largely in the Masaka Municipality. This cluster accounts for 17% of the villages surveyed and are located in less remote areas, largely in the peri-urban settings which may be an advantage for their entrepreneurial undertakings. Members of this cluster have invested in the pig enterprise in terms of pig housing, improved breeds and they undertake most of the pig husbandry practices, apart from servicing the sows. Many of the pig farmers in this cluster sell grown pigs for slaughter and may not own sows. Those with sows indicate a general lack of high quality boars within their villages, thereby forcing them to incur high transport cost in sourcing for boars outside their villages. This cluster has the advantage of availability of a number of livestock value chain supportive institutions, an average of 3. These include the National Agricultural Advisory Services (NAADS) and a number of micro-finance institutions such as BRAC (formerly known as Bangladesh Rural Advancement Committee) and the Foundation for International Community Assistance (FINCA). Some of these institutions play an advisory role to the pig farmers and in some cases provide inputs in the form of piglets or pig housing materials. Most of the pig farmers, especially women in this cluster belong to a farmer and/or pig producers association, possibly as a result of initiatives of the institutions operating in the area. This cluster has strong growth opportunities for increasing productivity and income, especially for women due to proximity to urban demand centres in addition to the already existing producer groups and other institutions.
In order to assess income growth potentials through output and input market linkages, constraints and opportunities were assessed for the different clusters (Table 7). The main output market related constraint for producers in clusters 1 and 2 which are largely rural-based, is limited market opportunities. Most of the producers in these clusters sell pigs to neighboring butchers who are also few in some of the locations, thereby resulting in depressed prices especially during beginning of school terms when most producers aim to raise school fees from pig sales. Owing to the strategic location of pig producers in Cluster 3, market opportunities are not indicated as a constraint. Lack of market information, especially on input and output prices for different market outlets and location is however indicated by a relatively high proportion of pig producers, 40% from this cluster. A general problem by producers across the clusters is lack of capacity on pig live-weight estimation. This impacts negatively on the producers as the buyers purposely underestimate the weight of the animals in order to maximize on their margins.
|
Table 7: Constraints associated with input and output markets |
|||
|
Constraints |
Cluster 1 Rural extensive and cooperative-poor producers |
Cluster 2 Rural mixed intensive and extensive producers |
Cluster 3 Peri-urban intensive associational type producers |
|
Output markets |
|
|
|
|
Lack of market information |
11.1 |
28.6 |
40.0 |
|
Limited pig market opportunities |
55.6 |
42.9 |
0.0 |
|
Lack of capacity on pig live-weight estimation |
44.4 |
71.4 |
80.0 |
|
Input markets |
|
|
|
|
Knowledge on input use |
22.2 |
4.8 |
20.0 |
|
Poor quality inputs |
66.7 |
71.4 |
80.0 |
|
Expensive inputs |
90.2 |
97.1 |
90.7 |
|
Unavailability of outlets supplying inputs |
33.3 |
61.9 |
20.0 |
Expensive and poor quality inputs are a constraining factor for producers across all the clusters. The poor quality is largely linked to feeds and veterinary products and is indicated by producers as being sub-standard and less effective due to adulteration or counterfeit products. For clusters 1 and 2, an additional constraint is unavailability of outlets supplying inputs within their localities since most of the input stockists are located in urban centres or large markets. The fact that most of the producers indicate inputs to be expensive may imply that they do not receive good returns on their investments and strategies to improve their returns from the pig enterprise need to be encouraged.
This article has investigated the different typologies of smallholder pig production systems in Uganda by employing a cluster analysis and utilizing variables that capture farmers’ cooperative involvement, institutional linkages and some intensification related indicators. It has also explored the input and output market related constraints and opportunities associated with the different typologies. A hierarchical cluster analysis using Ward’s method has produced three clusters, with differences between the clusters being largely attributed to the intensification related indicators. Cluster 1 which has been classified as “rural extensive and cooperative-poor producers” is characterized by low producer involvement in farmer groups and low investments in the pig enterprise. The producers may not invest much in the enterprise due to poor linkages to profitable output markets. It is therefore not surprising that their main constraint is limited output market opportunities.
Cluster 2 which is a mixed group comprising both extensive and some intensive producers has similar output market constraints as those in cluster 1 but the difference is the relatively high involvement of producers in farmer groups and higher levels of investments in the pig enterprise compared to cluster 1. Since both clusters are rural based, an associated constraint is access to inputs due to high cost and few outlets supplying the inputs. Both clusters may benefit from improved input and output market integration through collective action and linkages with input providers. Efforts to strengthen collective action through producer groups have been advocated as important avenues for enhancing smallholder producers’ bargaining power, minimizing transaction costs associated with marketing and improving access to inputs and technologies (Ouma et al 2010 and Bellemare and Barrett 2006).
Cluster 3 which is classified as “peri-urban intensive associational type producers” has several advantages including its close proximity to demand areas. There are existing supportive institutions providing inputs, advisory services as well as financial credit to the farmer groups, most of which are women groups. The major lesson drawn from this cluster is the importance of collective action as avenues for accessing extension support, inputs and credit. The main constraining production factor for this cluster is access to breeding services. Efforts to promote breeding services such as through use of artificial insemination may be beneficial. The main market related constraint for this cluster is lack of market information. Access by producers from this cluster to market information services especially on prices, alternative market outlets and associated transaction costs may enable identification of existing and new market opportunities for pig/pork and related products in order to improve incomes. In all the clusters, capacity needs on different aspects such as pig live weight estimation, input use and husbandry practices is noted. Poor input quality is a common constraint across all clusters. The constraint largely relates to substandard and less effective inputs due to adulteration and counterfeit products. Other studies such as Nkonya and Kato (2001) have also highlighted this as a major constraint in the input marketing sector in Uganda. Input marketing regulations exist but there is laxity in enforcement. However, in order for input use to be effective, there is need for commitment by the public sector or its agencies for quality regulation.
The authors are grateful to the Smallholder Pig Value Chains Development (SPVCD) Project in Uganda, financed by the European Commission through the International Fund for Agricultural Development (IFAD). Thanks also to the smallholder pig farmers who participated actively in this study by openly sharing their experiences. The staff of Kamuli, Masaka and Mukono district local government authorities and VEDCO in Kamuli are gratefully acknowledged for their support during the study.
Aldenderfer M S and Blashfield K 1984 Cluster analysis. Beverly Hills, Sage Publications.
Bellemare M F and Barrett C B 2006 An ordered tobit model of market participation: evidence from Kenya and Ethiopia. American Journal of Agricultural Economics 88(2): 324-337.
CGIAR Research Program on Livestock and Fish 2011. More meat, milk and fish by and for the poor. Research Proposal submitted to the CGIAR Consortium Board.
Everitt B S 2001 Cluster analysis. 4th edition London.
FAOSTAT 2011 FAO Statistics Division: Food and Agriculture Organization of the United Nations.
Gore P 2000 Cluster analysis. Handbook of Applied Multivariate Statistics and Mathematical Modeling, Academic Press.
Jansen H G 2006 Policies for sustainable development in the hillside areas of Honduras: a quantitative livelihood approach. Agricultural Economics 34: 141-153.
Katongole C B, Nambi-Kasozi J, Lumu R, Bareeba F, Presto M, Ivarsson E and Lindberg J 2012 Strategies for coping with feed scarcity among urban and peri-urban livestock farmers in Kampala, Uganda. Journal of Agriculture and Rural Development in the Tropics and Subtropics 113 (2):165–174.
Mutua F K, Arimi S, Ogara W, Dewey C and Schelling E 2010 Farmer perceptions on indigenous pig farming in Kakamega district, Western Kenya. Nordic Journal of African Studies, 19: 43-57.
Nkonya E and Kato E 2001 Agricultural input marketing in Uganda. IFPRI Policy Workshop, June 25-26, Kampala, Uganda.
Ouma E, Jagwe J, Obare G, and Abele S 2010 Determinants of smallholder farmers’ participation in banana markets in Central Africa: The role of transaction costs. Agricultural Economics 41: 111-122.
Petrovici D and Gorton M 2005 An evaluation of the importance of subsistence food production for assessments of poverty and policy targeting: Evidence from Romania. Food Policy 30 (2): 205-223.
Punj G and Steward D 1983 Cluster analysis in marketing research: review and suggestions for application. Journal of Marketing Research 20: 134-148.
Staal S J, Owango M, Muriuki H, Kenyanjui M, Lukuyu B, Njoroge L, Njubi D, Baltenweck I, Musembi F, Bwana O, Muriuki K, Gichungu G, Omore A and Thorpe W 2001 Dairy systems characterization of the Nairobi greater milk shed. Smallholder Dairy Project Research Report, KARI/ MoARD /ILRI/DFID Collaborative Research Project Report, Nairobi, Kenya.
Tatwangire A 2013 Situation analysis of smallholder pig value chains in Uganda. http://livestock-fish.wikispaces.com/VCD+Uganda
Uganda Bureau of Statistics 2009 National livestock census report.
Van de Steeg J, Notenbaert A, Herrero M, Baltenweck I, Poole J, Ouma E and Pezo D 2013 Spatial targeting of pig value chains in Uganda. Unpublished report.
Waiswa C 2005 Porcine trypanosomosis in South-eastern Uganda: Prevalence and assessment of therapeutic effectiveness. Bulgarian Journal of Veterinary Medicine 8(1): 59-68.
Received 19 January 2014; Accepted 13 February 2014; Published 1 March 2014