Soil bio-test to evaluate comparative fertility of soils and effects of adding earthworm compost
Tran Thi Bich Ngoc and T R Preston*
National Institute of Animal Husbandry, Hanoi, Vietnam
bichngocniah75@hotmail.com
*Finca Ecológica, TOSOLY, UTA (Colombia)
AA #48, Socorro, Santander, Colombia
trpreston@mekarn.org
Abstract
This trial was conducted at the Livestock Research Center (LRC), Laos. The treatments were source of soils and levels of earth worm compost (EC) arranged in a 4*4 factorial with 4 replications, in a completed randomized block design . Maize was used to measure fertility of soils and effect of adding earth worm compost. Four types of soils were taken from different places around LRC (Good, medium and poor soil and sandy soil) and four levels of EC (0, 10, 20 and 30%). After mixing soils with levels of EC, samples were put into 1 liter capacity plastic bags and 3 seeds of maize were planted in each bag (4 bags per soil/indicator plant). Germination, plant height at every 5 days intervals and final weight of biomass after 25 days were measured.
There were significant differences between soils and between levels of EC in the growth in height of the maize, and a significant interaction for soil * EC. Maize growth after 25 days in soils of different origin varied from 25.5 to 53 cm and was closely correlated with organic matter and N content of the soils. There were no differences among the soils in maize growth (range from 62 to 74cm) when 10% earthworm compost was added to the soils even though there were marked differences in organic matter and N content. Maize height after 25 days and yield of fresh green biomass were closely correlated (R2 = 0.87)
The beneficial effects of adding earthworm compost to poor soils appear to be obtained at levels of less than 10% of the soil mixture and are only partially explained by improved organic matter and N status.
Key words: Bio-test method, earth worm compost, maize, nitrogen, organic matter, soil fertility
Introduction
Knowing the fertility of soils is important in agriculture particularly in making decisions on planting of crops. The measurement of the fertility of soils is usually done by chemical analysis for plant nutrients such as nitrogen (N), potassium (K), phosphorus (P) and trace elements, as well as physical measurements of soil structure. Such analyses require access to a laboratory and this is not feasible for most farmers, especially those with limited resources. Planting some indicator plants in the soil and measuring their growth and production is one way to measure fertility of soils in an indirect way (Chamnanwit Promkot 2001). According to Boonchan Chantaprasarn (2003), maize is a better indicator plant than rice.
Soil organic matter plays an important role in soil fertility. It serves as a nutrient source for soil micro-organisms and helps to maintain sol moisture. Worm castings (or compost) are a valuable source of soil organic matter as well as being rich in plant nutrients. It is reported that earthworm castings contain over five times the available nitrogen, eleven times the phosphorus, three times the exchangeable magnesium, eleven times the potash, and one-and-a-half times the lime (calcium) found in good topsoil (http://www.worldwise.com/soilferandfe.html). Another report indicates that to mulch with worm compost, apply a one-inch layer to the soil around the plants, and be sure the worm compost is not piled against plant stems. To amend soils, worm compost can be spread one half to two inches thick over the soil and mixed in before planting, or mixed into the bottom of seeding trenches or transplanting holes. (http://www.deq.state.ok.us/factsheets/local/worms.pdf)
Hypothesis
Mixing of worm compost with the soil samples will increase the growth of maize but the increase will depend on the basic fertility of the soils that are chosen.
Materials and methods
Location
The experiment was carried out in the Livestock Research Center, Nang Xuan village, Laos during 29 days starting on 13 September 2005.
The experimental design
Types of soil
- Sand (S) in LRC
- Poor soil from a garden near to LRC (P)
- Medium soil from the border of a river near to LRC (M)
- Good soil in a rice field near to LRC (H)
Level of worm compost (EC)
- 0% EC
- 10% EC; 90% soil
- 20% EC; 80% soil
- 30% EC; 70% soil
The experimental layout of the plots is in Table 1.
|
Table 1: Experimental layout |
||||||||
|
Block 1 |
PEC20 |
SEC0 |
MEC20 |
PEC10 |
SEC30 |
SEC10 |
MEC10 |
PEC0 |
|
HEC20 |
SEC20 |
HEC10 |
HEC30 |
MEC0 |
PEC30 |
MEC30 |
HEC0 |
|
|
Block 2 |
PEC0 |
MEC0 |
SEC10 |
MEC10 |
HEC20 |
SEC30 |
PEC20 |
SEC20 |
|
SEC0 |
HEC30 |
HEC0 |
MEC30 |
PEC30 |
PEC10 |
MEC20 |
HEC10 |
|
|
Block 3 |
HEC30 |
SEC0 |
PEC20 |
SEC30 |
MEC30 |
HEC10 |
HEC20 |
SEC10 |
|
PEC0 |
MEC10 |
SEC20 |
PEC30 |
MEC0 |
PEC10 |
MEC20 |
HEC0 |
|
|
Block 4 |
PEC20 |
SEC30 |
PEC10 |
MEC10 |
HEC30 |
SEC0 |
MEC30 |
PEC0 |
|
SEC10 |
MEC0 |
SEC20 |
HEC20 |
HEC10 |
MEC20 |
HEC0 |
PEC30 |
|
Procedure
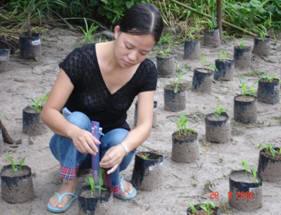
The substrates were put into plastic bags (capacity 1 litre). Three seeds of maize were planted in each bag according to the experimental layout in Table 1. After germination, plants were removed to leave only one maize plant in each bag. Many holes were put around each bag so the excess water could drain away. Water was applied uniformly to all bags every morning and evening. Color of plant, germination and growth of plants were observed every day.
Measurements
The dry matter (DM), organic matter (OM) and N content of soils and earth worm compost were analyzed at the beginning. The height of the plants was measured every 5 days over a total period of 30 days. After 30 days, the plants and roots were removed from the bags, washed free of soil, and weighed 30 minutes later, the green parts (leaves and stems) and the roots separately.
 |
 |
|
Picture 1: Measuring the height of maize every 5 days |
|
Laboratory analyzes
AOAC (1990) methods were used to determine N and ash. DM was analyzed by micro-wave radiation (Undersander et al 1993).
Statistical analyzes
The linear regression of height on days was calculated to determine growth rate in height. The ANOVA GLM option of the Minitab (2000) software was used to analyze the data. Sources of variation were: soils, levels of compost, interaction soils*compost, blocks and error. The Tukey test in the Minitab software was used to separate mean values when the F-test was significant at P<0.05.
Results and discussion
Chemical composition of soils
The DM content was highest in the sandy soil without EC and lowest in the good soil mixed with 30% of EC. In contrast to the DM, organic matter was highest in the good soil mixed with 30% of EC and lowest in the sandy soil without EC. The soils with high organic matter content were also high in nitrogen (Figure 1). Most of the soils in this experiment were acidic (pH < 7) except the medium soil with 30% of EC that had a pH of 7.04. Nitrogen content was highest in the good soil mixed with 30% of EC (0.68%) and lowest in the sandy soil without EC (0.15%).
|
Table 2: Chemical composition of soils |
|||||
|
Measurements |
Level of EC |
Good soil |
Medium soil |
Poor soil |
Sandy soil |
|
|
0 |
68.8 |
77.7 |
83.8 |
87.5 |
|
DM (%) |
10 |
67.5 |
75.5 |
81.0 |
84.4 |
|
|
20 |
66.2 |
73.3 |
78.2 |
81.2 |
|
|
30 |
64.9 |
71.2 |
75.4 |
78.1 |
|
|
0 |
0.43 |
0.36 |
0.34 |
0.15 |
|
N (% on DM) |
10 |
0.51 |
0.44 |
0.41 |
0.23 |
|
|
20 |
0.59 |
0.52 |
0.49 |
0.32 |
|
|
30 |
0.68 |
0.61 |
0.58 |
0.42 |
|
|
0 |
11.5 |
6.72 |
3.18 |
2.74 |
|
OM (% in DM) |
10 |
11.7 |
7.37 |
4.19 |
3.79 |
|
|
20 |
11.9 |
8.02 |
5.19 |
4.84 |
|
|
30 |
12.0 |
8.67 |
6.20 |
5.89 |
|
|
0 |
5.15 |
6.39 |
4.48 |
4.58 |
|
pH |
10 |
5.49 |
6.61 |
4.89 |
4.98 |
|
|
20 |
5.83 |
6.82 |
5.29 |
5.37 |
|
|
30 |
6.17 |
7.04 |
5.7 |
5.77 |

Figure 1: Relationship between nitrogen and organic matter
of soils mixed with levels of worm compost
Germination
Germination of maize after 3, 4, 5 and 6 days did not differ among treatments. Similar results were reported by Boonchan Chantaprasarn (2003) and George et al (1999).
|
Table 3: Germination of maize (%) |
|||||
|
|
Level of EC |
Good soil |
Medium soil |
Poor soil |
Sand soil |
|
3 days |
|
||||
|
|
0 |
66.7 |
25.0 |
41.7 |
25.0 |
|
|
10 |
83.3 |
50.0 |
33.3 |
66.7 |
|
|
20 |
50.0 |
58.3 |
58.3 |
58.3 |
|
|
30 |
66.7 |
58.3 |
50.0 |
58.3 |
|
4 days |
|
|
|
|
|
|
|
0 |
75.0 |
91.7 |
75.0 |
66.7 |
|
|
10 |
91.7 |
75.0 |
66.7 |
83.3 |
|
|
20 |
75.0 |
83.3 |
75.0 |
66.7 |
|
|
30 |
75.0 |
75.0 |
91.7 |
75.0 |
|
5 days |
|
|
|
||
|
|
0 |
75 |
100 |
75 |
66.7 |
|
|
10 |
91.7 |
83.3 |
66.7 |
91.7 |
|
|
20 |
75.0 |
83.3 |
83.3 |
66.7 |
|
|
30 |
75.0 |
75.0 |
91.7 |
75.0 |
|
6 days |
|
|
|
||
|
|
0 |
75 |
100 |
75 |
83.3 |
|
|
10 |
91.7 |
83.3 |
66.7 |
91.7 |
|
|
20 |
75.0 |
83.3 |
83.3 |
75.0 |
|
|
30 |
75.0 |
75.0 |
91.7 |
75.0 |
Growth in height of the maize
There were significant differences in maize height between soils, and levels of worm compost (Tables 4 and 5). The significant interaction between the two factors indicates that the major effect of the addition of the earthworm compost was between levels of zero and 10% and that this was much more marked in the poor and sandy soils (Figure 2). There were no apparent benefits in any of the soils in adding more than 10% of earthworm compost.
|
Table 4: Analysis of variance for plant height at 25 days |
||||||
|
Source |
DF |
SS |
Adj SS |
MS |
F |
Prob |
|
Soil |
3 |
543 |
529 |
176 |
4.55 |
0.007 |
|
Compost |
3 |
12719 |
12652 |
4217 |
109 |
0.001 |
|
Soil*Compost |
9 |
1780 |
1780 |
198 |
5.11 |
0.001 |
|
Error |
46 |
1782 |
1782 |
39 |
|
|
|
Total |
61 |
16824 |
|
|
|
|
|
Table 5: Mean values for height of maize (cm) after 25 days in soils of different origin mixed with different levels of earthworm compost |
||||
|
Earthworm compost, % |
High |
Medium |
Poor |
Sand |
|
0 |
50.3 |
48.3 |
25.5 |
31.8 |
|
10 |
68.8 |
62.1 |
66.0 |
73.9 |
|
20 |
71.8 |
70.0 |
72.9 |
72.0 |
|
30 |
79.4 |
69.3 |
73.6 |
75.4 |

Figure 2: Effect of addition of earthworm compost on height of maize grown in different soils
The relationships between maize growth and the N and OM contents of the soil / compost combinations were rather low (Figures 3 and 4), indicating that other factors provided by the earthworm compost were influencing the growth of the maize. This can be seen when the relationships between maize growth and soil organic matter are compared for the un-supplemented soils (Figure 5) and the same soils with addition of 10% earthworm compost (Figure 6). In the former there is a strong positive relationship (R2 = 0.90) while for the latter the relationship is negative and less strong (R2 = 0.71).
The benefits of adding earthworm compost to poor soils are clearly demonstrated. However, there is obviously no simple explanation for the positive effect of relatively small quantities (less than 10%) and that improved organic matter and N status are only two of the elements provided by the compost. Elliot et al (1990) found that earthworm compost generally has a higher ammonium concentration and water-holding capacity than bulk soil samples, and they constitute sites of high denitrification potential.
 |
 |
|
| Figure 3. Relationship between N content of the soils and growth of maize |
Figure 4. Relationship between organic matter content of the soils and growth of maize |
 |
 |
|
| Figure 5. Relationship between growth of maize and
organic matter content of the soils in absence of earthworm compost |
Figure 6. Relationship between growth of maize and organic matter content of the soils with 10% of added earthworm compost |
Maize biomass
Due to an unfortunate accident (two buffaloes entered the experimental area the night prior to intended harvest of the maize and consumed a proportion of the plants), total biomass yield could not be measured directly. However, there were sufficient surviving plants distributed over the range of the experimental treatments to enable the calculation of the regression between plant height and green biomass yield (Figure 7). There was a close relationship between plant height and the fresh matter yield of the green part of the maize biomass (leaves and stems), indicating that plant height of maize after 25 days growth could be used as the indicator of total green biomass yield and hence of soil fertility.

Figure 7: Relationship between biomass and height of maize after 25 days
Conclusions
-
Maize growth after 25 days in soils of different origin varied from 25.5 to 53 cm
and was closely correlated with organic matter and N content of the soils
-
There were no differences among the soils in maize growth when 10% earthworm compost was
added to the soils even though there were marked differences in organic matter and N content
- The beneficial effects of adding earthworm compost appear to be obtained at levels of less than 10% of the sol mixture and are only partially explained by improved organic matter and N status
Acknowledgements
The authors acknowledge the support of sidaSAREC for funding this mini-project - a part of the MSc program course through the regional MEKARN project. Sincere thanks are given to Ms. Lampheuy Kaensombath, Mr. Chhay Ty and Livestock Research Center staff who provided valuable assistance in helping to analyze the data in the laboratory and preparing the materials for conducting the experiment. .
References
AOAC 1990 Official methods of analysis. Association of Official Analytical Chemists, Arlington, Virginia, 15th edition, 1298 pp.
Boonchan Chantaprasarn 2003 Measuring fertility of soils by the bio-test method. MEKARN Miniprojects 2003-2005 http://www.mekarn.org/msc2003-05/miniprojects/webpage/cont_mp.htm
Chamnanwit Promkot 2001 Study of the use of maize and water spinach in a biotest for evaluation of soil fertility. MEKARN Miniprojects 2001-2003 http://www.mekarn.org/minipro/cham.htm
Elliot P W, Knight D and Anderson J M 1990. Denitrification in earthworm casts and soil from pasture under different fertilizer and drainage regimes. Soil Biology and Biochemistry. 22 (5): 601-605.
George N E et al 1999 Soil nitrogen dynamic and maize production in municipal solid waste amended soil. Agronomy Journal 91: 1009-1016.
Parkin T and Berry E 1994. Nitrogen transformations associated with earthworm casts. Soil Biology and Biochemistry. 26 (9): 1233-1238.
Minitab 2000 Statistical software Minitab Inc, Version 13.31.
Undersander D, Mertens D.R and Theix N 1993. Forage analysis procedures. National Forage Testing Association. Omaha pp 154
Received 31 January 2006; Accepted 15 February 2006; Published 21 March 2006