| Livestock Research for Rural Development 12 (3) 2000 | Citation of this paper |
Income effects of fodder and herd management on small-scale milk producers in the northern Peruvian Andes
T Bernet and C León-Velarde*
International Potato Center (CIP), Apartado 1558, Lima 12, Peru
t.bernet@cgiar.org
*International Livestock Research Institute (ILRI) and CIP, Apartado
1558,
Lima 12, Peru
A linear programming model was used to analyze the effects of different herd and fodder management levels on agricultural income of small-scale mountain dairy farmers in northern Peru. Results demonstrate that fodder and herd management strongly impact farm profits. There exists considerable potential to improve this situation, as many farmers in the study region are deficient in their fodder and herd management. When moving from average to high management levels, farmers could double their farm profits. In general, high mortality rates, long calving intervals, and inefficient fodder storage practices depress farmers’ incomes most. Because of feeding deficiencies, especially in the dry season, recommended extension activities primarily must emphasize fodder storage and improved pasture management, to subsequently also enhance better herd management practices.
Cattle play an important role in the Peruvian Andes. Since their introduction with the arrival of the Spaniards in the 16th century, animal traction has enabled farmers to more efficiently cultivate their crops, while also benefiting from a supply of dung, meat, and hides (CONCYTEC 1995). Keeping cattle has also enhanced farmers’ income security, as crop production involves high risk under these mountain conditions (Mosley 1982; Hanagarth 1989).
In the last decades, increasing domestic market demand for dairy products has created new production opportunities for mountain farmers in northern Peru (Bernet 1998). Since the establishment of Nestlé SA. in Cajamarca in the 1940s, regional milk production has rapidly expanded. The introduction of imported dairy cattle and artificial pastures have facilitated the intensification of milk production (Seifert 1990). The decay of the ‘haciendas’ in the 1960s and 1970s because of the agrarian reform (Taylor 1994) and elevated population growth (Urrutia 1996) have led to today’s predominance of small-scale farming (Rodríguez 1994; Malpartida et al 1994). Nonetheless, milk production has remained a most important activity for the Cajamarca region (Indacochea et al 1998).
In view of the need to enhance the profitability of small-scale farmers’ milk
production within the region to reach better living standards, this study assesses to what
extent improved fodder and herd management practices could rise farmers’ profits. The
analysis is based on the application of a farm household optimization model on a typical
small-scale valley farm, having access to irrigation to grow artificial pastures.
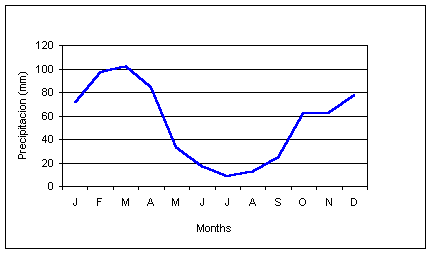
This study refers to Cajamarca, a mountain region in northern Peru. It is one of the three main milksheds in the country, thus milk is the main income source of the region besides mining (Seifert 1990). However, the importance of milk production varies strongly between farms, depending on farmers’ individual environmental conditions and socio-economic contexts (PIDAE 1995). In general, the most limiting factor for farmers in shifting toward milk production is access to irrigation water. Rainfall is seasonally distributed with a pronounced dry season from May to October (Figure 1).
Figure 1: Annual distribution of rainfall in Cajamarca (Encañada)
Source: based on ADEFOR weather station data (average of different years and stations).
Correspondingly,
the cultivation of permanent pastures is key for achieving fodder availability during the
whole year (Bernet et al 2000). Where access to irrigation water is limited, annual fodder
crops (mainly field beans and oats) and crop residues gain importance as a means to
partially overcome fodder scarcity in the dry season (Malpartida et al 1994).
Nonetheless, most milk is produced on farms that do have access to irrigation and thus are
in the position to cultivate artificial pastures (Malpartida et al 1994). Nonetheless,
common lack of irrigation water during the dry season reduces yields of artificial
pastures (Bernet et al 2000).
Table 1: Seasonality of fodder availability (%) |
||||
|
Rainy |
Dry |
||
December- |
March- |
June- |
September- |
|
Barley & field beans |
80 |
20 |
||
Ryegrass-clover |
33 |
36 |
18 |
13 |
Alfalfa and oats |
30 |
30 |
23 |
17 |
Rue |
100 |
|||
Maize |
100 |
|||
Wheat |
100 |
|||
Source: based on Reinders (1996). |
||||
Under irrigated conditions, Holstein and Brown Swiss cattle prevail,
and the use of moderate levels of feed concentrates to balance the dairy cows’
requirements, in contrast to the production of hay or silage, is fairly common in the
region. Herd management varies considerably between farms; but in general, mortality rates
especially of calves are high (up to 25 percent) and calving intervals are long (up to 17
months) (Reinders 1996).
This study is based on farm household survey and census data collected in the study region (Reinders 1996; Bernet and Tapia 1999). Moreover, Horber (1984) and CONCYTEC (1995) provided useful reference data and technical coefficients for feed and herd fertility (e.g., nutrient content of fodder, mortality rates, and calving intervals). A flexible linear programming (LP) farm household optimization model was used, where production coefficients can easily be changed in scenario analysis, to scrutinize potential income effects from different fodder and herd management (for details, see Bernet et al 1999). Since the model’s objective function is to maximize farmers’ annual agricultural income (or farm profit), defined as all income minus all costs of agricultural activities, the model solution derives for each scenario the most profitable production pattern. Agricultural income values farmers’ own production factors: family labour, land and equity.
The core element of the model, to properly reflect animal nutrition issues, is its equation setup for deriving feasible feeding solutions, given different herd and fodder management levels (as defined in different scenarios). In function of maximized agricultural income, the model derives the number of kept dairy cattle and a corresponding feeding pattern, consisting of own (green and stored fodder, and crop residues) and/or purchased feed concentrates. The model ensures that animals’ feed requirements for protein, energy, and fibre are covered and that the derived optimal feed mix does not exceed the animals’ feed capacity in terms of dry and fresh matter. Feed requirements and maximum intake are calculated from animals’ body weights and production levels (milk and meat) on a quarterly basis (three month periods), using equations derived from NRC (1988).
Regarding the fact that surveys indicate a large variation of fodder and herd management levels between farms, scenarios were defined that reflect these differences. The setup of a corresponding scenario analysis also helped to better assess the situation of individual farms, with specific management conditions. The analysis is based on five scenarios for each component, referring to five management levels for fodder and herd management. In this sense, two scenarios for “high” and “low” management levels contrast average management levels in the study region. All scenarios are roughly summarized in Figure 2, and the corresponding technical coefficients are presented in Appendices 1 and 2. The study assesses the relevance of these management levels in reference to those implemented, respectively lacking fodder conservation practices.
The analysis refers to a typical valley farm of 3.5 ha with access to
irrigation, as defined in Bernet and Tapia (1999). Based on Reinders (1996), a Holstein
breed was considered with milk production of 3,000 litres per lactation, being potentially
fed with fresh or stored fodder (hay and silage), feed concentrate, and crop residues. For
green fodder, ryegrass-clover was defined for pasture, and alfalfa and oats for cut
fodder; the latter could also be used for hay and silage production. Agricultural crops
(potatoes, cereals, and beans) were included in the model as production alternatives to
fodder crops. For all model applications, the following assumptions were made: no renting
of land, limited access to irrigation water, unrestricted hiring of additional labor force
(male and female), and the provision of loans when necessary. The purchase of all these
off-farm production factors are valued with common local prices.
Different fodder and herd management scenarios reflect different management levels. The fodder management scenarios express differences in feed availability and quality; herd management scenarios refer to differences in mortality rates, calving intervals, first insemination dates, and insemination costs. The ‘high’ herd management level relates to a case when mortality rates are kept low and calving intervals short (close to one year; see Appendix 1). Similarly, the ‘high’ level in fodder management describes a situation where the farmer implements optimal pasturing (early and intensive; see Appendix 2), implying low fodder losses and high quality fodder, characterized by a relatively low dry matter but a favorable energy and protein content (LBL 1998). Figure 2 shows schematically how the specific technical coefficients described in Appendices 1 and 2 are grouped to five scenarios for each component.
Although in practice a strong interaction exists between herd and fodder management (Lotthammer and Wittkowski 1994), the two management components were kept separate in the analysis to assess their specific effects on both income and production. As all fodder management levels or scenarios were confronted in the model with all herd management levels, the analysis results refer to 25 management combinations (5 x 5). Since fodder conservation practice is treated as an independent scenario, 50 model runs were executed in total, analyzing the impact of the 25 combinations of all fodder and herd management scenarios twice, with and without fodder conservation practices.

Figure 2: Schematic representation of the fodder and herd management scenarios (values of technical coefficients in Appendices 1 and 2)
Model results show that dairy farmers with low fodder and herd management levels have considerable potential to raise income by improving both management components (Figure 3). Hence, a farmer doubles agricultural income when moving from average to high management levels; similarly, his income declines drastically when moving from average to low management levels.

Figure 3: Income effects of different combinations of herd and fodder management levels.
Essentially, herd management impacts farmers’ agricultural income more than fodder management. When the herd management level is low, improved fodder management can even be unprofitable, since higher fertilization costs are not compensated by an increase in income. However, the implementation of an average fodder management level is important, and the importance of fodder quality increases when higher herd management levels are achieved (quantity is less critical).
Strikingly, income improves relatively the most when farmers move from an average to a high herd management level. This performance is explained by an increasing marginal gain with shorter calving intervals (Appendix 1) leading to proportionally higher income for milk and meat (Table 2) as cows come earlier in lactation, provoking not only higher total milk production but also increased animal sales due to higher replacement rates. Particularly profitable for farmers with good herd management is the surplus of heifers, which are well priced in the region given the high demand for dairy cattle, as a response of an increased demand for milk (Bernet 1998). In this sense, the achievement of a high herd management level is not only relevant for individual farmers, but is equally crucial for the milk-shed as a whole to augment the number of dairy cattle and hence expand milk production and total regional income.
Model results also manifest the importance of fodder conservation to adequately feed dairy cattle across the year. Access to stored fodder (hay and silage) is relevant under good and poor fodder management—although alfalfa substitutes to some extent the more common ryegrass-clover mixture under poorer fodder management conditions (Table 2). In general, the abundance of green fodder production in the rainy season and pronounced fodder scarcity in the dry season call for such a seasonal fodder transfer
This corresponding gain in production efficiency with fodder transfers more than compensate for the rising labor costs involved in hay and silage production (Table 2). In fact, the dissemination of fodder conservation practices could create important labor opportunities at the regional level.
The decline in income when no fodder is stored underscores the importance of fodder storage for dairy farmers within the given production context (Figure 4). When no fodder is stored, agricultural crops gain relative importance. But most important, farm profits are much lower. Under average fodder and herd management but not practicing fodder conservation, a farmer is expected to reach only 60 percent of the agricultural income he would otherwise gain (with hay and silage production). This income loss is relatively greater under poor herd management and relatively less pronounced at high herd management levels. When high herd management levels are implemented, milk production becomes clearly more profitable than agricultural crop production, expressed by a larger optimal herd size and higher fodder production.
.

Figure 4: Income effects of different combinations of herd and fodder management levels when no fodder is stored.
The lower farm profits when no fodder is stored is related to two reasons. First, the use
of feed concentrates is more costly than own-produced stored fodder; second, the lack of
hay and silage production provokes considerable inefficiencies within the production
system; while fodder lacks in the dry season, green fodder is underutilized during the
rainy season. Since the herd size is determined by the feed availability during the dry
season, the animals in the herd cannot keep up with pasture growth in the rainy season,
leading to general late pasturing with low nutrient content of the fodder (LBL 1998).
When feed concentrates are used to compensate for the lack of stored fodder, farmers face a considerable increase in labor costs as herd sizes become larger when more nutrients are available. This increase in labor demand is based on the fact that animals in the region are pastured by stake in small-scale farming, which is time-consuming (Bernet and Tapia 1999).
Table 3: Effect on income and production of different combinations of herd and fodder management levels when no fodder is stored. |
|||||||||
Herd management |
++ |
++ |
++ |
0 |
0 |
0 |
-- |
-- |
-- |
Fodder management |
++ |
0 |
-- |
++ |
0 |
-- |
++ |
0 |
-- |
Annual agricultural income (US$) |
3008 |
3005 |
1745 |
1130 |
1168 |
740 |
338 |
587 |
375 |
Change in income (reference Table 1) |
83% |
89% |
82% |
56% |
60% |
60% |
27% |
41% |
42% |
Income milk per year ($) |
5861 |
6011 |
2873 |
3555 |
2528 |
1721 |
1915 |
1982 |
1499 |
Per cow ($) |
554 |
554 |
554 |
480 |
480 |
480 |
447 |
447 |
447 |
Income sold animals per year ($) |
2754 |
2825 |
1350 |
927 |
659 |
449 |
272 |
282 |
213 |
Per cow ($) |
261 |
261 |
261 |
125 |
125 |
125 |
63 |
63 |
63 |
Surface used for agricultural crops |
27% |
0% |
16% |
47% |
35% |
22% |
58% |
40% |
30% |
Surface used for fodder crops |
73% |
100% |
84% |
53% |
65% |
78% |
42% |
60% |
70% |
Ryegrass-clover mixture |
62% |
83% |
44% |
45% |
36% |
39% |
36% |
34% |
36% |
Alfalfa |
0% |
0% |
31% |
0% |
21% |
29% |
0% |
19% |
26% |
Field beans and oats |
11% |
17% |
9% |
8% |
8% |
10% |
6% |
7% |
8% |
Cows (No.) |
11 |
11 |
5 |
7 |
5 |
4 |
4 |
4 |
3 |
Feed concentrate (kg /cow,day) |
2.6 |
3.0 |
2.3 |
2.2 |
2.0 |
2.1 |
2.5 |
2.3 |
2.3 |
Hired labor days per year (No.) |
359 |
374 |
101 |
172 |
89 |
9 |
8 |
18 |
1 |
For high management levels, it must be noted that a farmer with 11
cows who does not practice fodder storage gains less than a farmer with only 8 cows but
who does practice fodder storage. This clearly shows that common productivity measures,
such as ‘animal units per hectare’, ‘milk production per hectare’
etc., are unsound indicators for assessing farmers’ profits or production efficiency.
Indicators that express potential milk production from self-grown fodder are more
reliable, such as ‘produced crude protein per hectare’ or ‘produced
metabolizable energy per hectare’, etc.
It could be assumed that interventions that cause a reduction of current feed concentrate prices would partially compensate for the agricultural income losses provoked by the lack of fodder storage. However, considering a 20 percent subsidy on feed concentrates, the model results show that such compensation can only be expected under the condition of best herd management (Table 4). In this case, farmers would purchase higher amounts of feed concentrates—as a consequence of their reduced costs—enhancing total milk production with a higher number of cows. But in all other cases, agricultural income losses caused by lacking fodder conservation would not be compensated for, as the seasonal inefficiencies in fodder production are not removed (i.e., under-utilization of green fodder in the rainy season). In this context, agricultural crops remain important, not only because they are equally profitable as fodder crops in that setting, but also because they provide important feed from crop residues during the dry season.
In conclusion, the significant efficiency losses caused by the lack of stored fodder calls for extension interventions that emphasize fodder conservation practices. Likewise, the implementation of early and intensive pasturing is equally important especially for raising fodder quality. Hence, the implementation of fodder storage together with improved pasturing is an important first step to cost-effectively enhance farmers’ incomes while creating a better base for essential herd management improvements (Lotthammer and Wittkowski 1994).
The promotion of fodder storage practices seems also relevant from the regional perspective, as fodder conservation practices are labor-intensive within the context of small-scale farming, creating important off-farm work opportunities and value added. In contrast, stimulating the use of feed concentrate would lead to an outflow of capital to the lowland areas, where feed concentrates are produced in Peru.
Potential extension activities should go hand in hand with further research focusing on why most farmers currently lack better fodder and herd management, particularly in relation to fodder storage. Participatory research approaches seem appropriate to diagnose these issues and to examine apparent differences in farmer perceptions on the value of here-discussed practices. Since improved fodder management would stimulate the expansion and intensification of milk production, major milk buyers in the region could play a dominant role in supporting such work, as it is in their interest to augment daily milk collection (Bernet 1998).
Bernet T 1998 Past and present development of the Peruvian dairy sector: A base document for further research. Social Science Department Working Paper No. 1998-1. International Potato Center (CIP), Lima, Peru.
Bernet T, Hervé D, Lehmann B and Walker T 2000 Improving land use of slope farmers in
the Andes: An economic assessment of establishing small-scale sprinkler irrigation to
shift toward milk production. In process.
Bernet T and Tapia M 1999 Análisis de los sistemas de producción en la microcuenca
de la Encañada: Documento base para investigaciones y acciones futuras en la Sierra Norte
del Perú. Departamento de Ciencias Sociales, Documento de Trabajo No. 1999-1. Centro
Internacional de la Papa (CIP), Lima, Peru.
Bernet T, Ortiz O, Estrada D R, Quiroz R and Swinton S 1999 Tailoring agricultural
extension to farmer needs: a user-friendly farm-household model to improve decision-making
in participatory research. Proceedings of Systems Approaches for Agricultural Development
(SAAD III), November 8-10, Lima, Peru.
CONCYTEC 1995 Ganadería nativa y criolla en el Perú y el mundo – Ponencias y
conferencias. II congreso mundial de razas autóctonas y criollas. II simposio
internacional de ganado vacuno criollo. CONCYTEC, Cajamarca, Peru.
Hanagarth W 1989 Ecology and risk-spreading in the small-holding agriculture of the
semi-arid Puna in Bolivia. Plant Research and Development 30, 76-103.
Horber F 1984 Experiencias en pastos y crianza de ganado vacuno. Cooperación técnica
del gobierno suizo, Cooperación Técnica Suiza (COTESU), Lima, Peru.
Indacochea A, Avolio B, Bedoya L, Carrillo J, Negrón G, Sánchez L and Santillana M 1998
Cajamarca competitiva, Saywa ediciones s.r.l., Lima, Peru.
LBL 1998 Wirz Kalender für die Schweizer Landwirtschaft, Landwirtschafltiche
Beratungszentrale Lindau (LBL), Verlag Wirz, Basel, Switzerland.
Lotthammer K H and Wittkowski G 1994 Fruchtbarkeit und Gesundheit der Rinder,
Stuttgart.
Malpartida E, Pinares C and Bello J 1994 Sistemas de producción en la cuenca lechera
de Cajamarca. In: Hervé, D. and Rojas, A. (eds). Vías de intensificación de la
ganadería bovina en el Altiplano. ORSTOM, La Paz, Bolivia, 83-92.
Mosley P 1982 Marketing systems and income distribution: the case of milk producers in
highland Peru. Food Research Institute Studies, Vol. XVIII, No. 3., 275-291.
NRC 1988 Nutrient Requirements of Dairy Cattle. National Resource Council. National
Academy Press, Washington D.C., Estados Unidos.
PIDAE 1995 La Encañada – Caminos hacia la sostenibilidad. ASPADERUC
CONDESAN-CIP, Fondo Peru-Canada, Centro Internacional de la Papa (CIP), Lima, Peru.
Reinders H P 1996 Posibilidades para mejorar el sistema lechero en la Encañada, Peru.
Tesis. CONDESAN, Departamento de Agricultura Ecológica, Universidad Agrícola Wageningen,
Holanda.
Rodríguez J 1994 Cambios en la sociedad rural de Cajamarca. Debate Agrario 19, CEPES,
Lima, Peru.
Seifert R 1990 Cajamarca: Vía campesina y cuenca lechera. CONCYTEC, CAPLECAY, Lima,
Peru.
Urrutia J 1996 Relaciones laborales, empleo agrícola y sociedad rural en Cajamarca.
Debate Agrario 24, CEPES, Lima, Peru.
Taylor L 1994 Estructuras agrarias y cambios sociales en Cajamarca, siglos 16.-20.
Instituto de Estudios Latinoamericanos, Universidad de Liverpool, England.
Received 25 March 2000
|
|
|
|
|
|
||
Appendix 1: Herd management scenarios. |
|||||||
Scenarios |
|
Scenario 1 |
Scenario 2 |
Scenario 3 |
Scenario 4 |
Scenario 5 |
|
Management level |
|
-- |
- |
0 |
+ |
++ |
|
Sales prices (US-$ / kg) |
|
|
|
|
|
||
Calves (per kg body weight) |
1.0 |
1.0 |
1.0 |
1.0 |
1.0 |
||
Bulls (per kg body weight) |
1.1 |
1.1 |
1.1 |
1.1 |
1.1 |
||
Heifers (per kg body weight) |
1.5 |
2.0 |
2.5 |
3.0 |
3.5 |
||
Cows (per kg body weight) |
1.1 |
1.1 |
1.1 |
1.1 |
1.1 |
||
Milk |
0.204 |
0.204 |
0.204 |
0.204 |
0.204 |
||
Mortality rates (%) |
|
|
|
|
|
||
Cows |
2% |
2% |
2% |
2% |
2% |
||
Pregnant heifers |
8% |
7% |
6% |
5% |
4% |
||
Heifers |
10% |
9% |
8% |
7% |
6% |
||
Female calves |
25% |
20% |
15% |
10% |
5% |
||
Male calves |
25% |
20% |
15% |
10% |
5% |
||
Herd reproduction |
|
|
|
|
|
||
Calving interval (months) |
17.1 |
15.6 |
14.3 |
13.2 |
12.2 |
||
Natality |
0.7 |
0.77 |
0.84 |
0.91 |
0.98 |
||
Date of first insemination (months) |
22 |
20.5 |
19 |
17.5 |
16 |
||
Milk production |
|||||||
Milk production per lactation (litres) |
3000 |
3000 |
3000 |
3000 |
3000 |
||
Fat content of milk (%) |
3.6% |
3.6% |
3.6% |
3.6% |
3.6% |
||
Milk feeding to calves (litres) |
270 |
270 |
270 |
270 |
270 |
||
Body weight of cows (kg) |
470 |
470 |
470 |
470 |
470 |
||
Sanitation and insemination costs (US-$) |
|
|
|
||||
Mineral salts cow |
6 |
6 |
6 |
6 |
6 |
||
Sanitation cow |
41 |
41 |
41 |
41 |
41 |
||
Insemination |
0 |
7 |
14 |
21 |
28 |
||
Mineral salts young animals |
3 |
3 |
3 |
3 |
3 |
||
Sanitation young animals |
41 |
41 |
41 |
41 |
41 |
||
Remarks: Since the linear programming model is static, involving a one-year period, animal replacements are calculated such that herd size remains constant. Sold animals are valued with the corresponding market prices paid for these animals (see above).The higher sales price for heifers in the case of the high management level is linked to improved general herd management, being also related to higher insemination costs (see above). |
|||||||
|
|
|
|
|
|||
Appendix 2: Fodder management scenarios |
|||||||
Scenarios |
|
Scenario 1 |
Scenario 2 |
Scenario 3 |
Scenario 4 |
Scenario 5 |
|
Management level |
|
-- |
- |
0 |
+ |
++ |
|
Green matter prod. (tonnes/ha) |
How used |
|
|
|
|
|
|
Barley and field beans (dec-may) |
Cut |
15 |
18 |
21 |
24 |
27 |
|
Barley and field beans (jun-nov) |
Cut |
14 |
16 |
18 |
20 |
22 |
|
Ryegrass-clover |
Pastured |
50 |
60 |
70 |
80 |
90 |
|
Alfalfa |
Cut |
22 |
26 |
30 |
34 |
38 |
|
Rye |
Residue |
2.3 |
2.3 |
2.3 |
2.3 |
2.3 |
|
Maize (grain) |
Residue |
2.28 |
2.28 |
2.28 |
2.28 |
2.28 |
|
Wheat |
Residue |
2.4 |
2.4 |
2.4 |
2.4 |
2.4 |
|
Fallowed land |
Pastured |
4.5 |
4.5 |
4.5 |
4.5 |
4.5 |
|
Fertilization costs (US-$/ha) |
|
|
|
|
|
||
Barley and field beans |
Cut |
0 |
20 |
40 |
120 |
180 |
|
Ryegrass-clover |
Pastured |
0 |
0 |
10 |
135 |
260 |
|
Alfalfa |
Cut |
0 |
0 |
0 |
100 |
200 |
|
Field losses (%) |
|
|
|
|
|
||
Barley and field beans |
Cut |
5% |
5% |
5% |
5% |
5% |
|
Ryegrass-clover |
Pastured |
30% |
28% |
25% |
23% |
20% |
|
Alfalfa |
Cut |
10% |
8% |
6% |
4% |
2% |
|
Dry matter content (%) |
|
|
|
|
|
||
Concentrate (Purina) |
96% |
96% |
96% |
96% |
96% |
||
Hay (barley and field beans) |
Cut |
89% |
89% |
89% |
89% |
89% |
|
Silage (barley and field beans) |
40% |
40% |
40% |
40% |
40% |
||
Barley and field beans |
Cut |
25% |
25% |
25% |
25% |
25% |
|
Ryegrass-clover |
Pastured |
22% |
21% |
20% |
19% |
18% |
|
Alfalfa |
Cut |
22% |
21% |
20% |
19% |
18% |
|
Rye |
Residue |
91% |
91% |
91% |
91% |
91% |
|
Maize (grain) |
Residue |
91% |
91% |
91% |
91% |
91% |
|
Wheat |
Residue |
91% |
91% |
91% |
91% |
91% |
|
Fallowed land |
25% |
25% |
25% |
25% |
25% |
||
Crude protein content (% in DM) |
|
|
|
|
|
||
Concentrate (Purina) |
20% |
20% |
20% |
20% |
20% |
||
Hay (barley and field beans) |
9% |
9% |
9% |
9% |
9% |
||
Silage (barley and field beans) |
11.5% |
11.5% |
11.5% |
11.5% |
11.5% |
||
Barley and field beans |
Cut |
11% |
11% |
11% |
11% |
11% |
|
Ryegrass-clover |
Pastured |
7.5% |
8.5% |
9.5% |
10.5% |
11.5% |
|
Alfalfa |
Cut |
11% |
13% |
15% |
17% |
19% |
|
Rye |
Residue |
1% |
1% |
1% |
1% |
1% |
|
Maize (grain) |
Residue |
4.8% |
4.8% |
4.8% |
4.8% |
4.8% |
|
Wheat |
Residue |
0.8% |
0.8% |
0.8% |
0.8% |
0.8% |
|
Fallowed land |
4.8% |
4.8% |
4.8% |
4.8% |
4.8% |
||
Metabolizable energy (kcal ME / kg DM) |
|
|
|
|
|
||
Concentrate (Purina) |
2580 |
2580 |
2580 |
2580 |
2580 |
||
Hay (barley and field beans) |
2000 |
2000 |
2000 |
2000 |
2000 |
||
Silage (barley and field beans) |
1850 |
1850 |
1850 |
1850 |
1850 |
||
Barley and field beans |
Cut |
2067 |
2067 |
2067 |
2067 |
2067 |
|
Ryegrass-clover |
Pastured |
2200 |
2250 |
2300 |
2350 |
2400 |
|
Alfalfa |
Cut |
1850 |
1950 |
2050 |
2150 |
2250 |
|
Rye |
Residue |
1730 |
1730 |
1730 |
1730 |
1730 |
|
Maize (grain) |
Residue |
1780 |
1780 |
1780 |
1780 |
1780 |
|
Wheat |
Residue |
1510 |
1510 |
1510 |
1510 |
1510 |
|
Fallowed land |
1780 |
1780 |
1780 |
1780 |
1780 |
||
Crude fibre content (% in DM) |
|
|
|
|
|
||
Concentrate (Purina) |
10% |
10% |
10% |
10% |
10% |
||
Hay (barley and field beans) |
35% |
35% |
35% |
35% |
35% |
||
Silage (barley and field beans) |
25% |
25% |
25% |
25% |
25% |
||
Barley and field beans |
Cut |
35% |
33% |
30% |
28% |
25% |
|
Ryegrass-clover |
Pastured |
30% |
28% |
26% |
24% |
22% |
|
Alfalfa |
Cut |
31% |
29% |
27% |
25% |
23% |
|
Rye |
Residue |
42% |
42% |
42% |
42% |
42% |
|
Maize (grain) |
Residue |
34% |
34% |
34% |
34% |
34% |
|
Wheat |
Residue |
42% |
42% |
42% |
42% |
42% |
|
Fallowed land |
34% |
34% |
34% |
34% |
34% |
||
Storage losses (%) |
|
|
|
|
|
||
Concentrate (Purina) |
9% |
7% |
5% |
3% |
1% |
||
Hay (barley and field beans) |
15% |
13% |
10% |
8% |
5% |
||
Silage (barley and field beans) |
15% |
13% |
10% |
8% |
5% |
||
Remarks: The nutrient values of oats with field beans remain unchanged for all scenarios, since the decreasing protein and energy content of oats is compensated for by the field beans when the crop is harvested later. |
|||||||